Ethanol plant map updated 4/22
At the end of March, USDA released its annual Prospective Plantings report, pegging 2020’s corn footprint at 96.990 million acres. If realized, that would be the third-largest effort on record, falling only lower than 1937 (97.2 million) and 2012 (97.3 million).
Those numbers caught analysts off-guard. The agency’s projection surpassed every analyst estimate, in fact, which ranged between 92.5 million and 96.4 million acres. Analysis from Farm Futures was closest to USDA’s numbers after surveying nearly 1,100 farmers earlier in March.
Farmers, too, are doubting whether 97 million acres is a realistic estimate at this point, given some other factors currently swirling through the industry.
“Is 97 million acres of corn even possible if futures are below $3.50?” one Nebraska farmer asked on Twitter. “Something has gotta give.”
Tumbling ethanol production may well be the catalyst to slash acres. When USDA surveyed farmers for the Prospective Plantings report, it was before the COVID-19 pandemic led to drastic social distancing measures across the country, which severely curbed crude oil, gasoline and diesel prices.
Ethanol futures soon followed lower. May futures went from $1.271 at the beginning of March down to $0.921 by the month’s end – a drop of nearly 28%. Production decreased in tandem, with a daily average of 840,000 for the week ending March 27. That was the lowest weekly tally in more than six years.
Cash bids at ethanol plants have dropped as much as $0.40 over the past couple weeks as ethanol inventories surged. Ethanol stocks rose to 25.7 million barrels as of March 27, a new record high, on the demand destruction following COVID-19 lockdown measures. A potential agreement between Saudi Arabia and Russia to curb oil production could help to restore stability back to energy markets, but fundamental demand shifts are still weighing heavily on ethanol prices.

“When you have state governors that are ordering people to stay at home, shelter in place, no one’s going to school, nobody’s going to church, they’re working from home – people aren’t driving,” notes Geoff Cooper, president and CEO of the Renewable Fuels Association.
Cooper says RFA expects between 2 billion to 3 billion gallons worth of capacity come offline as of April 3 “in an attempt to rebalance supply and demand.” There are about three dozen ethanol plants around the country that have “completely idled” their capacity, plus another two or three dozen facilities that have “greatly reduced” their output, Cooper says.
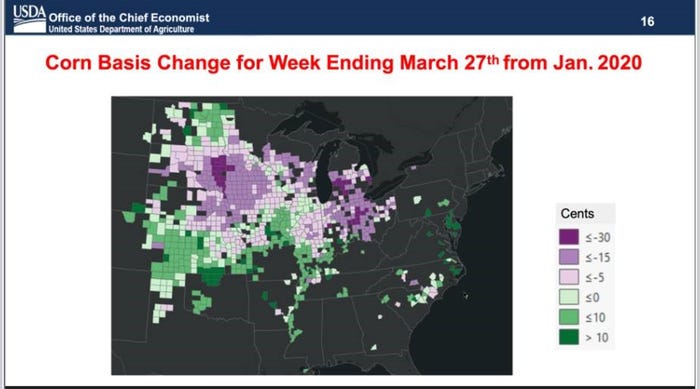
Here's an interactive map that shows what parts of the Corn Belt are seeing the most negative activity so far:
What’s happening in your area? Click here to fill out a very short survey and share your insights to help us keep this map as up-to-date as possible.
At the high end of RFA’s estimates, that’s about 1 billion bushels of corn that won’t be consumed by the ethanol industry. Will it be enough to lure a significant amount of corn acres into soybean production this year?
“Farmers have been kind of conditioned that if they can get open weather, and if they can get in and plant corn and make high yields, they’ll take their chances,” adds RFA chief economist Scott Richman.
Weather wildcards will certainly be worth monitoring as planting season unfolds. As the National Weather Service noted in its 2020 Spring Flood Outlook: “The entire [Mississippi River] watershed is experiencing very wet to saturated soils. This means very little runoff will be able to be absorbed by the soils so runoff from both snow melt and rainfall will efficiently move into the river systems. Local watersheds will also have an elevated risk for high runoff from snow melt or rainfall this spring.
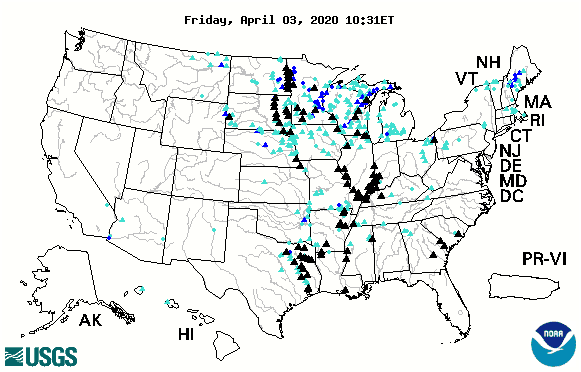
USGS’s latest flood map confirms the widespread levels of flooding across the Midwest and Plains in early April. Black triangles on the map below indicate areas where rivers are above flood stage, with turquoise triangles representing 95-98 percentile flooding and blue triangles representing 99 percentile or above.

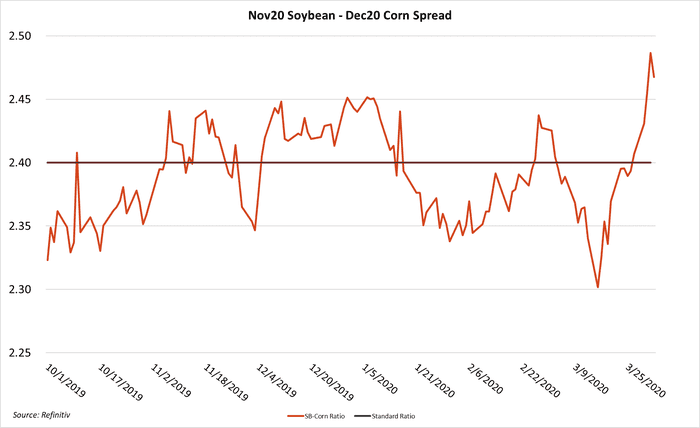
The corn/soy price ratio is not necessarily in favor of planting corn right now, too, explains Farm Futures grain market analyst Jacquie Holland.
“Over the past two weeks, the new crop soy-corn ratio has regularly traded between 2.40-2.49, indicating a preference for soybean acres,” she says. “But the market has not expressed an explicit desire for soybeans, either. Markets would provide more certainty for soybean acres if the ratio was 2.5 or higher. Even when the ratio dropped below 2.4 in the past six months, it was seldom at the 2.3 level that would show a strong market preference for corn.”

Add it all up, and the chance for 97 million corn acres looks more and more like a bad bet.
Read more about:
EthanolAbout the Author(s)
You May Also Like


