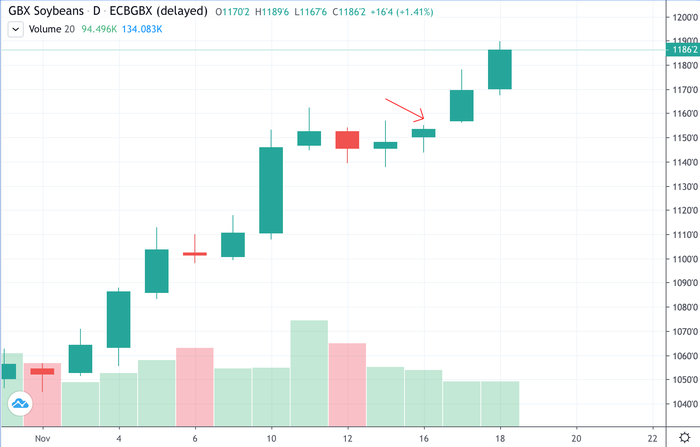
Tuesday’s market left a gap formation in the January soybean charts. A gap takes place when there is some shock to the market, usually with some new surprising information that builds overwhelming momentum either up or down.
For market action to be considered a gap, commodity prices must be higher than the high of the previous day or lower than the low of the previous day. In this particular soybean example, Monday evening trade gapped open a penny higher at $11.56 ¼ . The Tuesday trade continued to follow through, never trading lower.

What’s the cause?
There is usually a fundamental reason these things occur. In this case, you can take your pick between dry weather in South America, low carryover stocks, or continued Chinese exports. However, I would like to focus on the chart signals and what they actually mean.
There are several different types of gaps. What type of gap takes place depends upon the corresponding market action. We won’t often know exactly what type of gap took place until days, weeks or even months after the gap took place.
Breakaway gaps are unique in that they take place at the beginning of a new move. They can be significant because they can signal a sudden shift in the balance between supply and demand. So much pressure is built up for the market to make a move to the next level, that it has to “leapfrog” over a series of trades, effectively jumping over stop loss orders.
Once those on the wrong side of the market get out, this adds fuel to the fire as they liquidate their position. Breakaway gaps usually take a long time to get filled as they signify the start of a new and major long-term trend.
Measuring gaps
Measuring gaps are unique in that they are found at the middle of the trend move. Therefore, if the breakaway happened at 100, and the measuring gap happened at 150, you could project the trend to continue until 200. This is certainly not set in stone, but that is the generally accepted concept behind measuring gaps.
If Tuesday’s gap in January soybeans were a measuring gap, we would be roughly 50% through the upward trend that began in late August. Since we have rallied roughly $2.50 since then, that means we could rally an additional $2.50 yet. That would give us a price target of around $14.23.
This is probably wishful thinking.
Exhaustion gap clues
The exhaustion gap represents the beginning of the end. The exhaustion gap takes place towards the end of the major trend; the market has finally run out of steam either because there are no more buyers in the case of an upward trend, or no more sellers in the case of a downward trend.
Another way to look for exhaustion gaps is when the market frenzy is at its peak. High prices create demand rationing, which then generates increased supply. Even the “uninformed” shoe salesman has begun trading based off of what they have read in the paper. Once again, it may not be crystal clear on the day this event occurs what type of gap this is as we will look for further confirmation.
‘Brief market euphoria’
The gap left on Tuesday in January soybeans was likely just a common gap. Common gaps are also a result of brief market euphoria due to some government report or other market news but are not strong enough to change the major trend. Common gaps are usually filled quickly.
Sooner or later, the majority of gaps are filled. They can be filled the same day, or a month later.
Some traders are so confident that they will get filled, they will take an opposite position in the direction of the gap, believing that sooner or later, the gap will get filled.
Of course, you may not want to hold your breath because there is no telling when that may be.
Recent columns by Matthew Kruse:
Matthew Kruse is President of Commstock Investments. He can be reached at [email protected] or call 712-227-1110.
Futures trading involves risk. The risk of loss in trading futures and/or options is substantial and each investor and/or trader must consider whether this is a suitable investment. Past performance is not indicative of future results. Trading advice is based on information taken from trades and statistical services and other sources that CommStock Investments believes to be reliable. We do not guarantee that such information is accurate or complete and it should not be relied upon as such. Trading advice reflects our good faith judgment at a specific time and is subject to change without notice. There is no guarantee that the advice we give will result in profitable trades.
The opinions of the author are not necessarily those of Farm Futures or Farm Progress.
About the Author(s)
You May Also Like


