
Subscribe to receive top agriculture news
Be informed daily with these free e-newsletters
March 31, 2011
The USDA released its annual Prospective Plantings report this morning, showing U.S. farmers intend to plant 92.2 million acres of corn, 76.6 million acres of soybeans and 58 million acres of wheat this year. The corn and wheat numbers are higher than the trade expected, while the soybean number is slightly below the average trade estimate. Corn and wheat plantings would be above 2010 levels, while soybeans would be slightly below.
Note: Download a pdf of the RFA's analysis.
Based on this acreage estimate, corn yields would need to average 159.7 bu./acre to maintain carry-out levels from USDA’s March WASDE report. To increase carry-out stocks to near 1 billion bushels, an average yield of 163.5 bu./acre would be needed. Such a yield is entirely possible and in line with trend yield growth from the last 15 years. In 2009, American farmers set the all-time yield record at 164.7 bu.
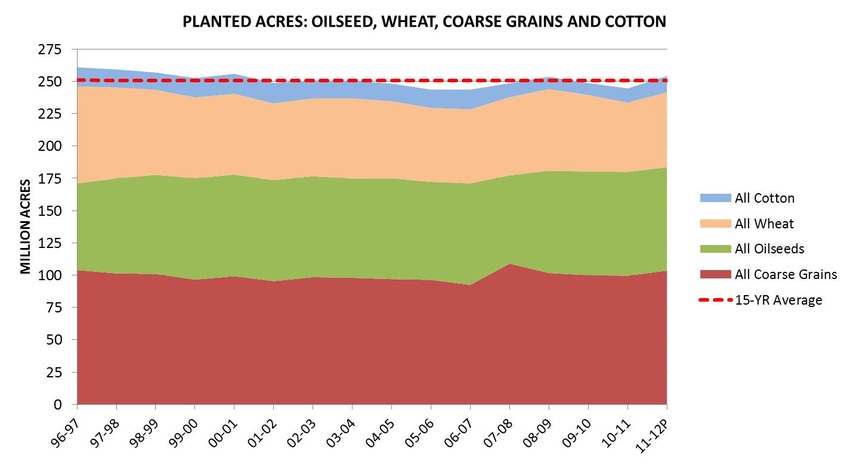
This morning's acreage estimate clearly shows that American farmers respond to signals from the marketplace. There is every expectation that farmers will once again produce the corn that is needed to meet all demands. And, they are doing it on the same number of acres they always have. As the chart shows (see gallery to the left), the 2011 projection of 254.2 million planted acres of major grain, oilseeds, and cotton falls squarely in line with historical trends. In fact, as recently as 2008, acres for these crops totaled 253.6 million acres. No doubt, many environmental activists will look at the 10 million acre increase over 2010 and howl about land use change. But, as the data clearly shows, American farmers are not needing to plow new acres to provide increasingly abundant harvests.
USDA also released its report on grain stocks. Corn stocks in all positions stood at 6.52 billion bushels, below what traders expected. The slight drop likely reflects stronger than anticipated demand from livestock. Ethanol production through the first three months of the year has remained relatively steady at 900,000 barrels/day, or 13.78 billion gallons annualized.
This lower-than-expected stocks level has sent speculators in the market scurrying, driving corn prices up by the 30¢ limit in early trading. This activity will likely lead to more bogus claims that U.S. ethanol production is somehow raising the price of food and starving people around the world. As is the case with land use concerns, the food price angst directed at ethanol is misplaced.
As the pie chart shows, ethanol’s net use of U.S. corn supplies is less than 25% of the total supply. The ethanol production process is one that provides both fuel and livestock feed. As such, when the livestock feed is credited back into the livestock feed market, the net corn use for ethanol production drops dramatically.
The same is true on a global basis. U.S. ethanol production uses just 3% of the world’s grain supply and none of its food grains like wheat and rice. Equally important, U.S. ethanol demand for grain is part of an ever-larger global supply. As the chart shows, U.S. ethanol demand for world grain is just a sliver of a growing pie.
Growing global demand for proteins in conjunction with unpredictable weather patterns has put a bit of a strain on global grain markets. At the same time, surging oil and energy prices are making it more expensive to process and ship food all around the globe. Such a convergence of factors requires a holistic approach to understanding what moves food prices. As the data show, U.S. ethanol production is nothing more than a bit player in the food price debate.
You May Also Like
Enter a zip code to see the weather conditions for a different location.


