July 24, 2020

Total inspections of corn, wheat, and soybeans for export from all major U.S. export regions totaled 2.1 million metric tons for the week ending July 16, according to the latest Grain Transportation Report. It includes 44.4 million bushels of corn, 19.4 million bushels of wheat and 17.5 million bushels of soybeans.
Total grain inspections were up 1% from the previous week (2.132 million metric tons v. 2.105 million metric tons) up 45% from last year and unchanged from the three-year average.
Inspections of corn increased 25% from the previous week, 44.4 million bushels from 35.5 million bushels).
Soybean inspections decreased 6%, 17.5 million bushels from 18.7 million bushels a week earlier.
Wheat inspections decreased 24%, 19.4 million bushels from 25.5 million bushels a week earlier.
Shipments to Latin America and Asia increased from the previous week, mainly as a result of higher corn inspections. Also, from the previous week, grain inspections decreased 7% in the Pacific Northwest and increased 1% in the Mississippi Gulf. For the last four weeks, corn inspections were up 103% from the same period last year. Likewise, for the last four weeks, total grain inspections were up 14% from the same period last year, but 1% below the three-year average.
Snapshots by sector
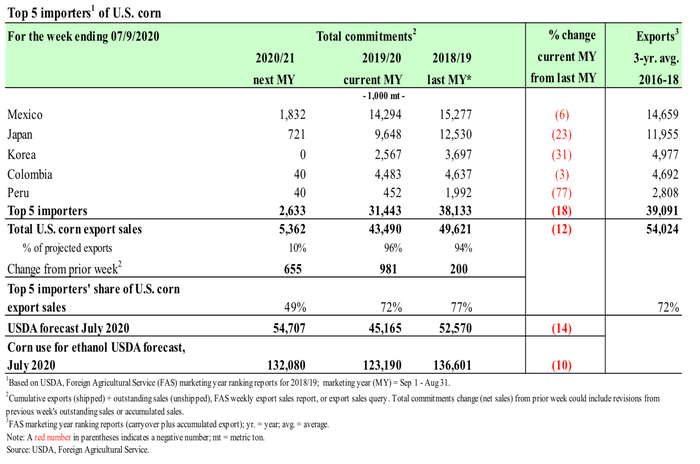
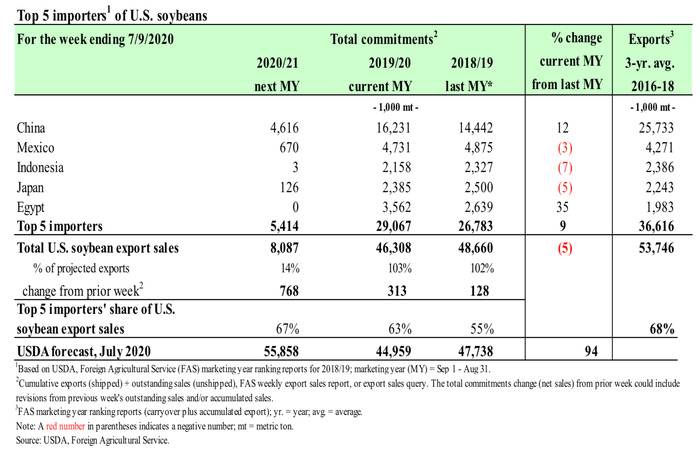
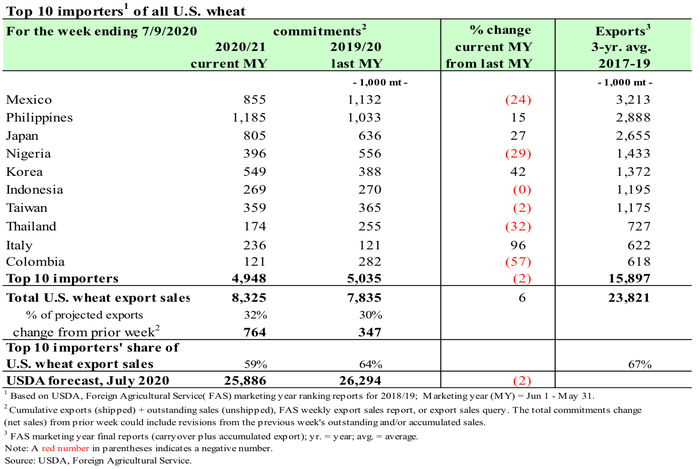
Export Sales - For the week ending July 9, unshipped balances of wheat, corn, and soybeans totaled 20.9 million metric tons. This represented a 9% increase in outstanding sales from the same time last year. Net corn export sales were 0.981 mmt, up significantly from the last week. Net soybean export sales were 0.313 mmt, down 67% from the previous week. Net wheat export sales were 0.764 mmt, up significantly from the previous week.


Rail - U.S. Class I railroads originated 19,443 grain carloads during the week ending July 11. This was 5% less than the previous week, 20% less than last year, and 13% lower than the three-year average. Average August shuttle secondary railcar bids/offers (per car) were $194 above tariff for the week ending July 16. This was $181 more than last week and $249 more than this week last year. There were no non-shuttle bids/offers this week.
Barge - For the week ending July 18, barge grain movements totaled 746,792 tons. This was 10% less than the previous week and 3% less than the same period last year. For the week ending July 18, 479 grain barges moved down river—66 fewer barges than the previous week. There were 590 grain barges unloaded in New Orleans, 12% less than the previous week.
Ocean - For the week ending July 16, 30 oceangoing grain vessels were loaded in the U.S. Gulf—67% more than the same period last year. Within the next 10 days (starting July 17), 35 vessels were expected to be loaded—41% fewer than the same period last year. As of July 16, the rate for shipping a metric ton (mt) of grain from the U.S. Gulf to Japan was $42.50. This was 8% more than the previous week. The rate from the Pacific Northwest to Japan was $21.50 per mt, 2% more than the previous week.
Fuel - For the week ending July 20, the U.S. average diesel fuel price decreased 0.5 cents from the previous week to $2.433 per gallon, 61.1 cents below the same week last year.
Source: USDA AMS Grain Transportation Report, which is solely responsible for the information provided and is wholly owned by the source. Informa Business Media and all its subsidiaries are not responsible for any of the content contained in this information asset.
You May Also Like


