Price changes during the first quarter of 2013 have resulted in lower expected returns for both corn and soybeans, but expected corn returns decreased more than soybean returns. On lower-productivity farmland, where corn-to-soybean yield ratios are more favorable than on higher-productivity farmland, soybeans after corn now is projected more profitable than corn after corn. For both high- and low-productivity farmland, continuous corn rotations are less profitable than corn-soybean rotations. Whether these expected return changes will impact plantings remains to be seen.
April 4, 2013

USDA's March 2013 estimates of corn stocks were substantially higher than trade estimates (see here), initiating a substantial decline in both corn and soybean prices during the past week. In this article, the relative profit impacts for 2013 crops of these price changes are examined. During the first quarter of 2013, price changes have increased expected soybean returns relative to expected corn returns.
Corn and Soybean Price Changes
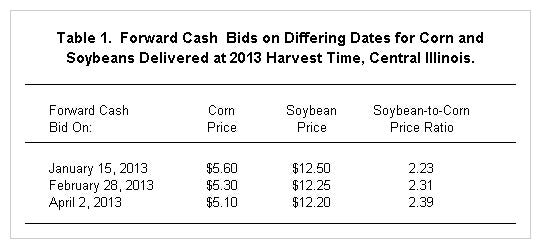
Central Illinois forward cash bids for 2013 harvest time were collected on Jan. 14, Feb. 28 and April 2 (see Table 1). Note that these are forward cash bids. Since the release of USDA reports on March 28, cash bids have declined more than harvest-time bids. For corn, cash prices fell roughly 90¢/bu. compared to roughly 40¢/bu. for harvest-time forward bids.

On Jan. 15, corn harvest-time bid was $5.60/bu. and soybeans were $12.50/bu., giving a soybean-to-corn price ratio of 2.23. On Feb. 28, corn forward bid was $5.30 and soybeans were $12.25, giving a soybean-to-corn price ratio of 2.31. Between Jan. 15 and Feb. 28, the soybean-to-corn price ratio increased from 2.23 to 2.31, indicating the price changes increased expected soybeans returns relative to expected corn returns.
Like what you're reading? Subscribe to CSD Extra and get the latest news right to your inbox!
On April 2, corn forward bid was $5.10/bu. and soybeans bid was $12.20/bu., resulting in a soybean-to-corn price ratio of 2.39. The soybean-to-corn price ratio increased from 2.31 on Feb. 28 to 2.39 on April 2, again indicating that price changes increased relative expected soybean returns.
Change in Expected Corn and Soybean Returns
To quantify price change impacts on profits, returns were calculated for corn and soybeans using yield and non-land costs estimates contained in the 2013 Illinois Crop Budgets for central Illinois farmland (see Handbook on Management page). Returns on both high and low productivity farmland were examined. Generally corn is relatively more profitable than soybeans on higher-productivity farmland because corn-to-soybean yield ratios favor corn more on higher-productivity farmland.
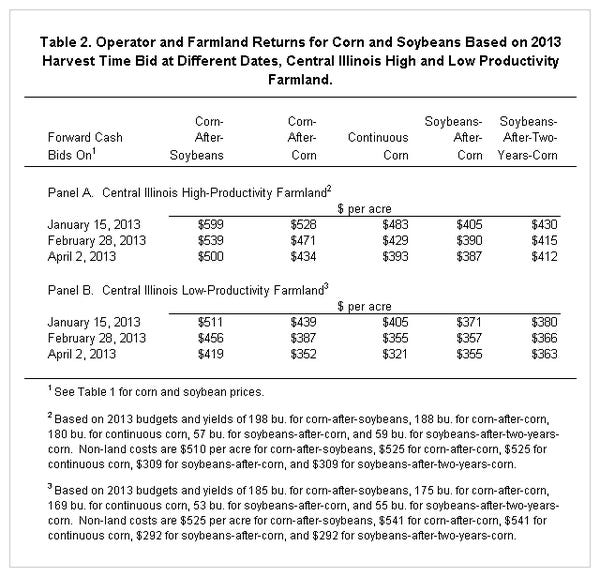
Operator and farmland returns were calculated for five crop combinations: corn after soybean, corn after corn, continuous corn, soybeans after corn and soybeans after two years corn (see Table 2). In the following, most attention will be given to a comparison of corn after corn to soybeans after corn returns, as this will likely be the choice being made this spring.

For high-productivity farmland, Jan. 15 cash bids resulted in a $528/acre corn-after-corn return compared to a $405/acre soybean-after-corn return – a difference of $123/acre in favor of corn. Feb. 28 prices resulted in an $81/acre difference ($471/acre corn-after-corn - $390/acre soybean-after-corn return). April 2 prices resulted in a $46/acre difference ($434/acre corn-after-corn return - $387/acre soybean-after-corn return). Profitability differences between the two crops substantially narrowed from $123/acre on Jan. 15 to $46/acre on April 2.
For low-productivity farmland, Jan. 15 harvest-time bids resulted in a $68/acre difference in corn-after-corn and soybean returns ($68 = $439 corn-after-corn return - $371 soybean-after-corn return). This difference narrowed to $29 using Feb. 28 bids ($29 = $387 corn-after-corn return - $357 soybean-after-corn return). Soybeans were more profitable than corn-after-corn using April 2 prices, with a -$3 difference ($352 corn-after-corn return - $355 soybean-after-corn return). Differences changed from a $123 positive favoring corn on January 15th to a -$3 negative favoring soybeans on April 2.
Read the article at farmdocDaily.
You might also like:
Moist Soil Sample Provides Precision, Better Accuracy in Estimating Potassium
You May Also Like


