USDA updates estimates of grain stocks on a quarterly basis, numbers that sometimes are deep, inside-baseball stuff. But reports out Sept. 28 for corn and soybeans, though hard to predict, have a bottom line that’s easy to understand.
Friday’s estimates will show how much corn and soybeans were left over at the end of the 2017 marketing year. This Sept. 1 number becomes the beginning stocks for the government’s projection of 2018 crop supply and demand. Coupled with imports and 2018 production, this is the amount available over the coming year.
Grain stocks are hard to predict because USDA can’t count every last kernel or bean. Merchandisers presumably keep an accurate count of inventory, and there are fewer of them to be surveyed. But some of their grain is always in transit, sitting in trucks, barges and railcars.
Farmers are less likely to know just how much is on hand, and USDA can survey only a portion of these growers. Getting data also has become more difficult as response rates to the inquiry drop.
Even a relatively small error from report to report can amount to a lot of bushels, especially as production exploded in recent years. Surprises, both bullish and bearish are possible. On average over the last 30 years cash soybean prices tend to be lower a week after the reports come out. The corn market tends to be lower initially, but is higher a little more than half the time after a week.
Comparing stocks reports from one quarter to the next shows how much “disappeared,” or was used during the three-month period, in this case over the summer from June to August. Disappearance is actually an apt description, because sometimes that is just seems to be what happens.
Some categories of usage are fairly easy to predict from quarter to quarter. USDA releases export inspections data weekly. This is compared to Census data already released for June and July to adjust August inspections for the official Census count that will be the final number when it is released.
Amounts used by processors can also be estimated fairly closely, including corn used by ethanol plants and soybeans crushed into meal and oil. Official crushings data from USDA already published for the first two months of the quarter is supplemented by ethanol production estimates put out weekly by the U.S. Energy Information Agency. Other industrial and seed uses also fairly predictable.
For soybeans, the National Oilseed Processors Association puts out its estimate of usage by members in the last month of the quarter a couple weeks USDA’s data comes out. Not all crushers are NOPA members, but the trend of the data is pretty consistent.
There’s a gaping hole in corn usage, however: the amount fed to livestock. Corn that can’t be accounted for by measurable uses like exports and ethanol is assumed to be either fed to livestock or the result of statistical error from survey to survey.
There is another potential source of surprise, however, especially for soybeans: residual usage. Sometimes this number is large enough that it likely means USDA’s last estimate of production in January was either too high or too low.
When it comes to this “residual” usage, USDA both giveth and taketh away from quarter to quarter. Sometimes the figure is negative, as the government tries to correct errors from previous data.
If there’s a surprise in Friday’s reports, it could come from these harder to estimate categories. Stocks of corn and soybeans were larger than expected in both the March 1 and June 1 estimates. If that trend continues for corn it’s likely a sign that less corn was fed during the marketing year than previous forecasts. A higher than anticipated soybean stocks number could mean the 2017 crop was larger than the January estimate.
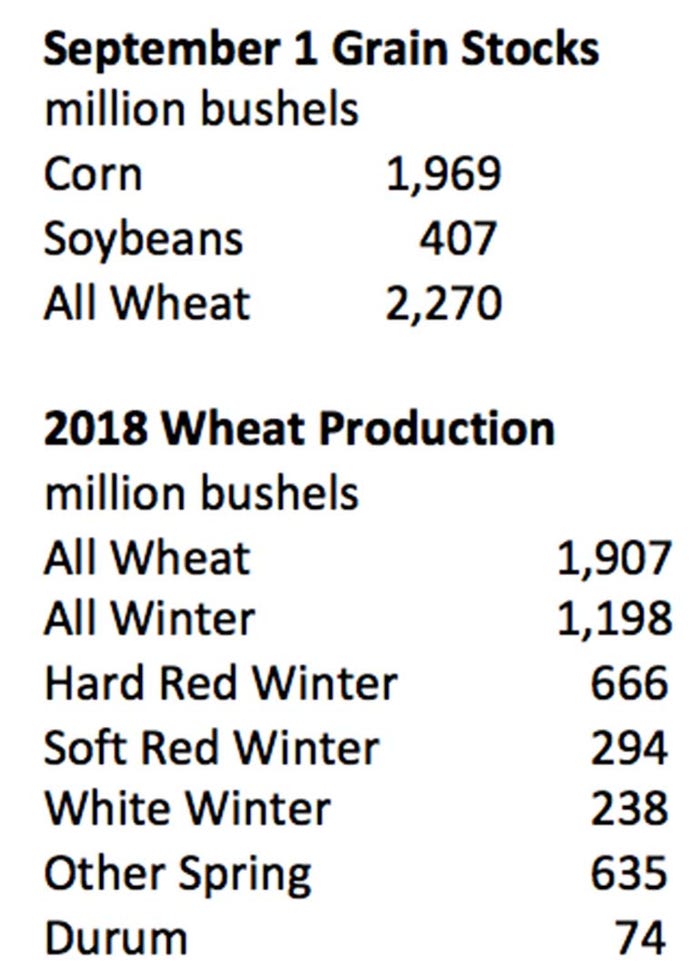
All these factors and more could come into play for the Sept. 1 wheat stocks estimate. USDA also updates wheat production estimates Friday. If history is a guide the crop could get bigger. Exports also got off to a slow start, and higher prices also probably meant less wheat was fed than normal.
As a result, quarterly wheat stocks could be put at 2.270 billion bushels, 4 million higher than a year ago, suggesting USDA may be too optimistic on its forecast calling for ending stocks to drop in the marketing year ending May 31.
Corn stocks of 1.969 billion bushels would be a little tighter than USDA’s last forecast for the 2017 crop of 2.002 billion bushels with stronger ethanol usage offsetting weaker feed demand. Soybean stocks could head the other direction, with our estimate at 407 million, 12 million above USDA’s last guess, indicating the 2017 crop was a little bigger than previously estimated.

About the Author(s)
You May Also Like


