The Month of January will bring many vital USDA reports that will certainly impact the corn and soybean balance sheets as well as price volatility moving forward.
These numbers of course are ever changing, and they will do just that over time. Weather impacting South American production will continue to be watched closely along with potential continued Chinese purchased from the United States.
Let us examine the current balance sheet outlooks for corn and soybeans as prepared by Advance Trading’s Research Department, and then let us look at vital upcoming reports from USDA for the important month of January 2021.
Keep in mind that every Monday evening the Research Department reviews all data and can change any of the said forecasted numbers due to the static or changing numbers relative to supply and demand each week.
Current Corn Outlook: Old crop carryouts at 1.607 Billion bushels or 10.8% stocks-to-use ratio with a Chinese potential to take down to 1.459 billion with a stocks-to-use ratio of 9.7%. New crop at 1.524 billion bushels in carryouts with a 9.9% stocks-to-use ratio.
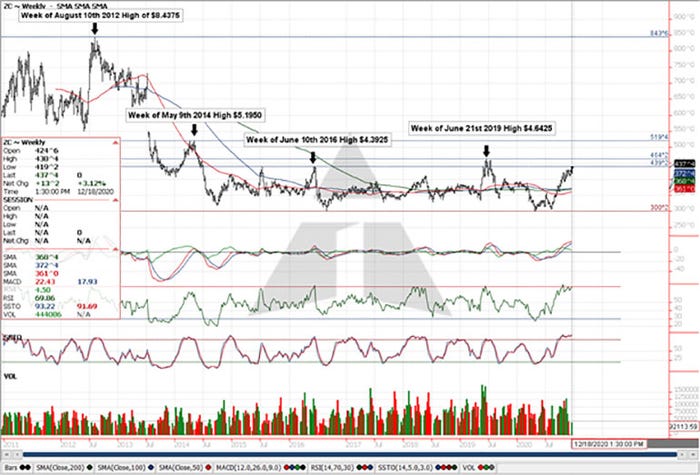
Weekly Continuous Corn Chart: For the week corn closed Up 13.25 cents to $4.3750; corn hit a high price of $4.3850 and was only ¾ a penny away from reaching previous highs found back on the week of June 10th in 2016.

Historical reference of previous prices achieved and the corresponding WASDE Reports, carryouts, and stocks-to-use ratios for Old and New Crop posted at that time listed below. (Note* No two years are ever the same and prices do not have to replicate past performance). The historical perspective given is simply to inform, and to respect the capability of a marketplace.

Current Soybean Outlook: Old crop carryouts of 118 million with a stocks-to-use ratio of 2.6%. Note the Chinese potential to take us down to 88 million with a stocks-to-use ratio of 1.9%. New crop at 218 million with a stocks-to-use ratio of 4.9%.
Let’s look now at historical prices using weekly continuous charts for corn and soybeans. Viewing “like years” relative to domestic U.S. stocks-to-use ratios and comparing the two can be deceiving, as one needs to remember that South American and Chinese production in both soybeans and corn has dramatically changed in the last six years let alone the last 10.
Likewise, one could argue that world demand has changed dramatically as well; both statements are true. However, to understand and respect a marketplace’s “potential” one cannot ignore history. Take a balanced and reasonable mindset when viewing historical prices, and as I state continually to customers in my daily writings, “Charts do not tell one where the market is going, but only where it has been”.
The various previous high prices for corn and soybeans, and both the old crop and new crop corresponding historical WASDE data and stocks-to-use ratios are posted to show what unfolded with the given data in said years. Learn, understand, and respect history, but please, do not expect replication of price history, as nobody knows what exactly will unfold moving forward.
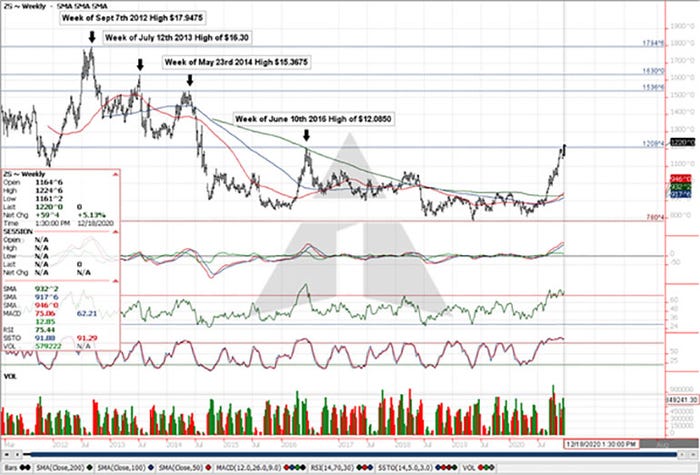
Weekly Continuous Soybean Chart: For the week soybeans closed up 59.50 cents to $12.20 and did reach a high of $12.2475. Previous highs were $12.0850 found on the week of June 10th, 2016!

Again, historical reference of previous prices achieved and the corresponding WASDE Reports, carryouts, and stocks-to-use ratios for old and new crop posted at that time listed below. (Note* No two years are ever the same and prices do not have to replicate past performance). The historical perspective given is simply to inform, and to respect the capability of a marketplace.

Several key reports coming
January holds several key reports of which will be interesting from both a domestic and world supply demand perspective.
On Tuesday January 12th, those critical reports are the following: Crop Production looking at the official 2020 U.S. crop production totals, the Quarterly Grain Stocks, the WASDE or World Agricultural Supply Demand Estimates, and finally Winter Wheat seedings.
These numbers along with continued South American weather and Chinese activity, will be driving continued volatility in the marketplace. 2020 has certainly been a year many would like to forget; however, the initial reports of 2021 will set the tone moving forward that may create a year the many will possibly enjoy looking back on and fondly remembering. Time will tell!
Contact Advance Trading at (800) 664-2321 or go to www.advance-trading.com
Information provided may include opinions of the author and is subject to the following disclosures:
The risk of trading futures and options can be substantial. All information, publications, and material used and distributed by Advance Trading Inc. shall be construed as a solicitation. ATI does not maintain an independent research department as defined in CFTC Regulation 1.71. Information obtained from third-party sources is believed to be reliable, but its accuracy is not guaranteed by Advance Trading Inc. Past performance is not necessarily indicative of future results.
The opinions of the author are not necessarily those of Farm Futures or Farm Progress.
About the Author(s)
You May Also Like


