For most of you, what is happening in Agriculture right now will only happen once in your career. For a few (like me), this might be the 3rd time.
It is very rare when Supply and Demand curves move much. Demand curves are usually slow to move and are often affected more by policy change than anything. International trade policy, tariff wars, developing environmental programs like ethanol, and international fiscal policy wars, are a few examples.
Supply curves can move more frequently and temporarily as a major world producer is hit with one or two years of adverse production. This of course has become less of a threat as we have more than doubled our yield potential and increased high producing acres worldwide over time.
Yet, what you are witnessing today is a major shift in demand. We believe this could be one of those times you must plan and participate in. What is incredibly unique about this situation, is that the timing of this demand shift, is oddly combined with a cyclical weather event as well as unique fiscal policy.
Major bull markets accompanied by demand curve shift
The 70s: In 1972-74 the Russian grain robbery occurred when a shortage of food occurred during a time of horrible U.S. Ag economic conditions. The U.S. made a deal to benefit our foe in hopes of relieving international tensions while knowing we had an oversupply of food – but where details of the deal were not fully disclosed.
When Russia started buying U.S. wheat and corn, the market responded, but with doubt and distrust that it could become anything long lasting. More a “one and done” feeling by most traders, until the market realized the size and scope of the deal; eventually USDA made huge revisions.
This caught many in the industry off guard. End users were short of needs and futures markets exploded. Corn futures rallied from a $1.09 per bushel in September of 1971 to $3.90 a bushel by July of 1973. This was a $2.81 cent rally, or a 257% price increase.
The 2000s: In 2001-2007 the U.S. demand curve shifted out due to ethanol policy. USDA began tracking actual ethanol usage in 2002 with 996 million bushels of grind. By 2007 ethanol grind hit 3.2 billion bushels.
This demand curve shift, combined with a U.S. yield loss in 2005 and 2006, resulted in an ending stocks decline from 2.1 billion bushels down to 900 million bushels, approximately a 60% loss over a two-year period. Corn futures rallied from a low in November of 2005 at $1.85 to a high in June of 2008 at $7.65 per bu.
Additional influences during this era were a combination of fund money entering into commodities as an asset class as well as a decline in the U.S. dollar below 92.00. This was a $5.80 rally, or a 313% increase in price.
Today: U.S. corn demand curve has shifted due to a more friendly trade policy as well as demand growth in China that far exceeds production capabilities. Chinese corn stocks have been declining for four years as the country has out consumed production. In 2020 China also experienced floods, a drought in the North, and army worm problems in the northeast causing a tightening availability of supply. China needs U.S. corn which again opened a door for the U.S. to relieve international tensions while knowing we had an oversupply of food.
The question on the table is how many tons? USDA was reluctant to change their import forecast from 7 million metric tons (mmt) up towards the 25 to 30 mmt that private industry suspects China needs. On the November WASDE report, the World AG Outlook Board raised Chinese imports to 13 million metric tons from 7 mmt. This added 325 million bushels to our demand curve and sharply reduced U.S. carryover from 2.7 billion bushels estimated in August, to 1.7 billion bushels on the current report.
This is a 40% loss in ending stocks in just three months -- and is unprecedented.
Corn futures put a low in at $3.07 in August 2020 as a deal with China materialized. We are currently at $4.15. This is a $1.08 rally or a 35% increase in price.
More price upside likely
Obviously looking at these statistics, one would have to think that further price appreciation is most likely, especially when we see a major shift in fund positions from a major short in agricultural commodities to becoming a major long.
That demand adds to the upward price potential as those buyers of futures compete with end users who are short bought and need to buy cash grain. This bidding pressure removes the ability for end users to be patient and wait for breaks, and forces them to enter the market more aggressively.
Additionally, fiscal policy around the world is to provide stimulus to combat negative economic effects of COVID-19. This stimulus is inflation friendly and dollar negative. The U.S. dollar has gone from 103.00 to 93 and is most likely going to drop below 92 like it did in the 2005-2007 era. The current move in U.S. dollar has made our corn $0.40 cheaper to an international buyer compared to a domestic buyer. Keeping our corn prices competitively priced with the world in an era where the world needs corn is very similar to the 1970 -1973 era.
Notes of caution
We are in an era now where farmers in the U.S. Canada, Mexico, Russia, Ukraine, China, Brazil, Argentina, Paraguay and a few others can respond with acreage shifts quickly and efficiently with high yield-producing seed. Thus it is possible to believe that a demand shift in today's environment will be shorter lived then those in the past. We have also looked at a study where the buyers bought out ahead by 60% of a year's needs at this time of year, resulting in a trickle of demand in the balance of the year. Those years typically had a price high in the first quarter and then prices moved lower.
U.S. producers have experienced three years of financial pressure most comparable to 1981-1986 when bankruptcy rates moved significantly higher. The current grain price run has stopped the bleeding. Thus we feel it is very important for our clientele to understand the significance and potential size of the price rally we could be looking at, and yet be focused on the profitability of your farm’s operation.
Have a plan that will manage your voyage through this era successfully. The way we see your best route is too move towards having years sold out ahead, at profitable margins, while protecting the potential upside with options. This moves you away from being a gambler tracking ups and downs of the market, to a revenue curve that is stable if prices go down but if prices go up your options will offset your sale and allow you to sell those same bushels at a higher price.
Here are three revenue charts that we have taken from the www.AgMarket.app which is available to all of our clients.
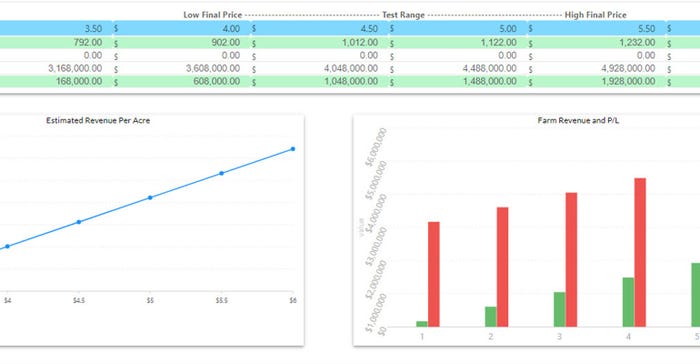
This graph shows you how a revenue curve on a farm in Iowa will vary as the market moves up and down. Assuming normal yield, basis +.10 Blair, 4.5%, $75 commissions and typical margin costs for a hedge. This shows the revenue curve on the left for your hedge position which in this case is no sales made – 100% ownership. Revenue is near breakeven at $3.50 and $1342/acre at $6.00. The chart on the right shows a red bar reflecting the bushels that you have at risk and how they increase in value as the market goes up and the green bar which reflects the overall profitability of the farm as the market moves.

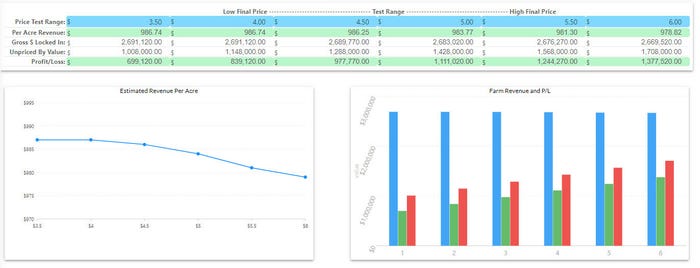
This example shows you the revenue curve if we sell 68% ahead at $4.40 (number we feel is reasonable), lock in a profit and walk away. You can see the revenue curve on the left has become flat which represents those bushels sold. The Graph on the left now shows that no matter how low the market goes you will make $986 per acre. It also shows that if the market moves up to $6 you'll make about $8 less. This is due to the fact that as the market moves higher you will need margin money for your hedges. This program is smart enough to calculate that cost as well as commissions and fees. The chart on the right shows the value of bushels sold in blue bars ( a nice calm color) and the value of bushels unsold in red (represent stress at times), and the green bars are the profitability of the farm. The profitability of the farm has become a lot more stable and it is impossible for the farm to go unprofitable regardless of price. The only problem with this strategy is that your business partner will probably be looking at $978 per acre versus the first graph that shows $1,300 per acre at $6.00 and will be unwilling to forgo that profit potential.

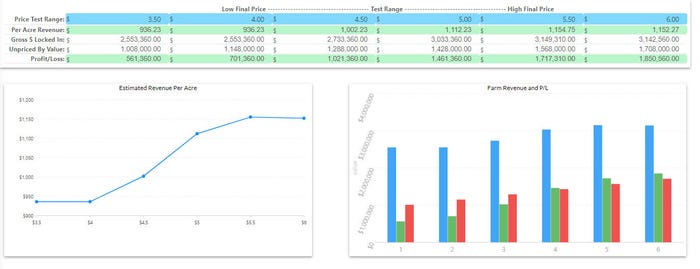
The third set of graphs reflect locking in 68% of your estimated production and protecting the upside with an option strategy. To be fair, we used today's quotes for at the money options relative to our proposed selling price and of course that could be different. We also want to point out that this is just one option idea that may only be palatable for some clients. But all clients should feel comfortable with one of the different option ideas, which will give the client upside income potential and yet protect revenue if markets collapse. In this example , the farm locks in 68% of potential bushels at the same $4.40 price as the example above but spent some money to by options that will allow revenue to increase as markets go up. The cost of those options caused the guaranteed farm income to drop from $986 down to $936 per acre. This is still a very profitable environment and eliminates 100% of the downside price risk on the bushels sold. The value of buying these options shows that if futures rally to $6, the farm’s income will increase to $1152.27 per acre. Now you and your business partner can agree as you have guaranteed the farm a profit no matter what happens to price and yet If the market does rally to $6, the farm will get 85% of the entire revenue potential as if it had done no hedging at all.

AgMarket Consulting and AgMarket.Net, the Farm Division of JSA, provides consulting and brokerage services to the agricultural industry. We believe we are in an era that could be career making for many people as long as they have a plan to manage the profitability of the farm while capturing the potential of a market that could move further than anyone thinks --in any direction.
Call us at 844-4Ag-Mrkt (844-424-6758)
The risk of loss in trading futures and/or options is substantial and each investor and/or trader must consider whether this is a suitable investment. AgMarket.Net is the Farm Division of John Stewart and Associates (JSA) based out of St Joe, MO and all futures and options trades are cleared through ADMIS in Chicago IL. This material has been prepared by an agent of JSA or a third party and is, or is in the nature of, a solicitation. By accepting this communication, you agree that you are an experienced user of the futures markets, capable of making independent trading decisions, and agree that you are not, and will not, rely solely on this communication in making trading decisions. Past performance, whether actual or indicated by simulated historical tests of strategies, is not indicative of future results. Trading infromation and advice is based on information taken from 3rd party sources that are believed to be reliable. We do not guarantee that such information is accurate or complete and it should not be relied upon as such. Trading advice reflects our good faith judgment at a specific time and is subject to change without notice. There is no guarantee that the advice we give will result in profitable trades. The services provided by JSA may not be available in all jurisdictions. It is possible that the country in which you are a resident prohibits us from opening and maintaining an account for you.
The opinions of the author are not necessarily those of Farm Futures or Farm Progress.
About the Author(s)
You May Also Like


