


Subscribe to receive top agriculture news
Be informed daily with these free e-newsletters
2014 cash-flow and payback ratios are not pretty. Just one year ago, corn prices were $7, and corn production was profitable. But August and September were cruel months, and corn prices made a rapid adjustment to $4, where they remain today.
Despite lower prices, I am reluctant to call this a bear market. The distinguishing feature of a bear market is a trend of persistently lower prices. That is not an accurate description of the current market. Since October, corn prices have been remarkably stable. In southwestern Minnesota, cash corn prices since harvest have bounced around a narrow range of $3.80-4.10 per bushel. New-crop bids for the 2014 crop are stuck in the same range. Where’s the volatility? The corn market is asleep.
The problem is deeper than the trend, and centers on $4 corn. Just a few years ago, $4 corn was a dream. But production costs are higher: $4.50 or higher in 2014 by my projection - and yesterday’s dream is today’s problem. How long might this difficult situation stick around?
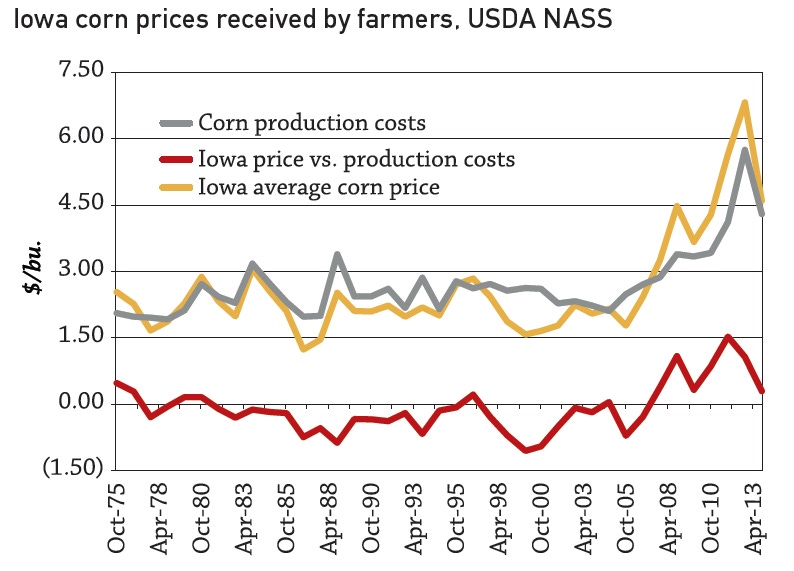
I went looking for answers with two data sources. The first is “Commodity Costs and Returns” as estimated by USDA_ERS. I compared ERS estimates of cash corn production costs for the North-Central region (1975-1995) and the Heartland region (1996-2012) to the Iowa average corn price as reported by USDA’s National Agricultural Statistics Service. While the ERS modified its regional definitions, Iowa is central to both the Heartland and north-central regions.
While both numbers are very broad measures of corn costs and prices, a comparison of the two (see chart) led me to the following conclusions.
1. It is hard to exaggerate just how good prices have been relative to costs since the fall of 2006. Other than a brief two-month period in summer 2009, corn prices have been higher than costs.
2. It is unnerving to note just how long the dry spells can last. August 1984 to May 1988 - 46 consecutive months with prices below costs. August 1990 to February 1995 - 55 consecutive months. May 1997 to August 2002 - 52 consecutive months. Each of these long dry spells followed an eventful year in the corn market; the droughts of 1983 and 1988, and 1996, the first year corn broke $4. The 2012 drought was an equally eventful year.
When the 2013 ERS estimates are finally published, we will learn that corn prices have once again sunk below production costs, starting with last year’s harvest. The numbers are not pretty, and the idea that the current situation will pass quickly may be wishful thinking. Spring is near and with it will come (I hope) volatility and a few market rallies. Look for opportunities to price 2014 corn.
You May Also Like
Enter a zip code to see the weather conditions for a different location.


