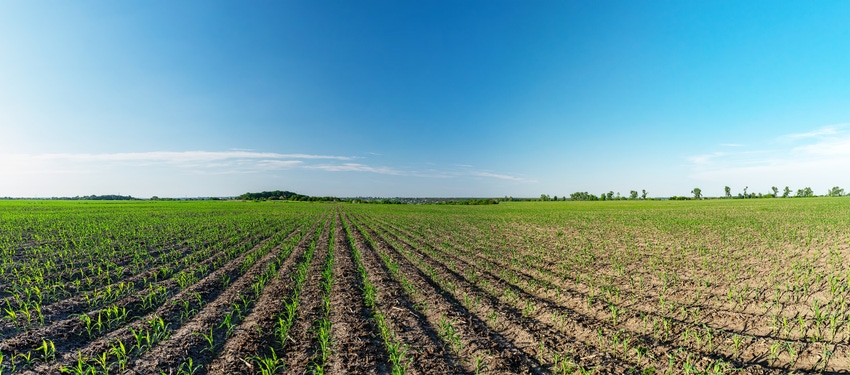
A good start is important in many endeavors in life, including growing a corn crop. But how U.S. fields begin isn’t necessarily how they’ll end. So here are four factors to watch over the next three months that could affect pricing opportunities.
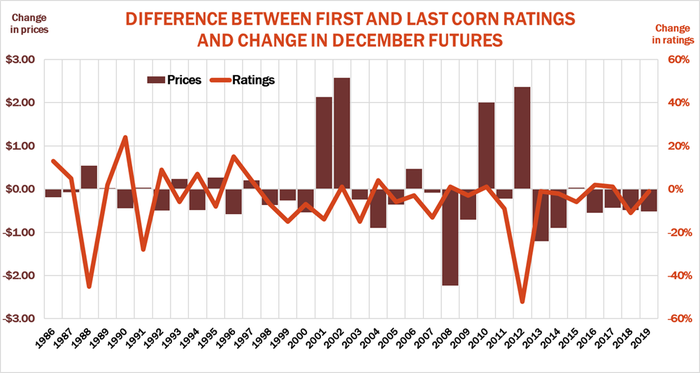
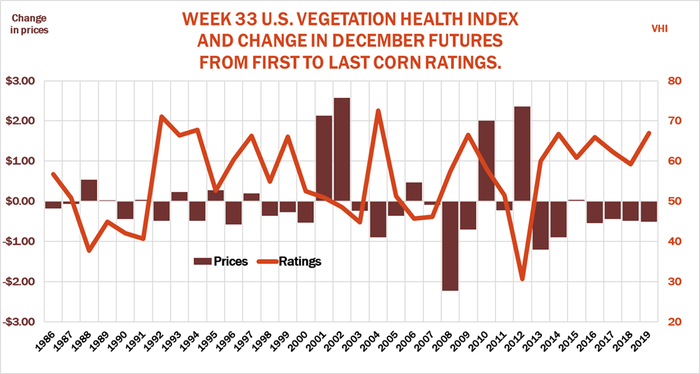
Crop ratings. USDA’s weekly condition ratings are one of the best barometers of market swings, especially over the course of the growing season. Changes from the first to final ratings of a season tend to track changes in December corn futures prices.
Week-to-week improvement or decline in crop conditions are also associated with market gains or losses, but some weeks appear to be more important than others. The reports for the fourth week of June and right after Independence Day show the most sensitivity to price swings – not surprising since that’s when weather is crucial for pollination.
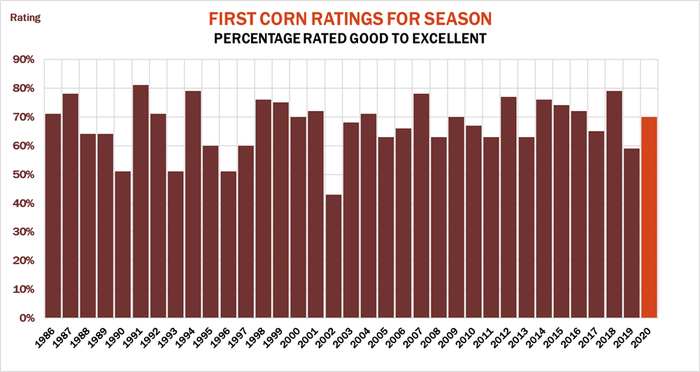
This year: Good early crop ratings don’t guarantee good yields. But so far conditions appear favorable. The first ratings showed 70% of U.S. corn fields rated good to excellent, and the reading improved to 74% this week, above the long-term average of 67%.
Money flow. Tracking weather during the growing season can be difficult at times because forecasts are constantly changing. But you don’t have to be a weatherman to know which way the wind is blowing in the market. Just follow the money.
Positions held by commodity funds follow shifting forecasts, with money moving in and out depending on how traders view the weather risk.
Sometimes buying by funds is defensive, such as when bearish traders cover short positions. Other times the buying represents speculators pushing bullish bets, letting winning positions run. As is the case with price moves caused by crop ratings, the fourth week of June appears to be the most sensitive time for fund managers historically. Money swings also seem to drive price moves towards the end of July, when the crop is either made or not, ahead of USDA’s first survey of growers and their fields in August. Money flow can be important in the last weeks of September as well, when harvest hedging can show up.
This year: Friday’s Commitment of Traders showed non-commercial large traders held their biggest short position on record, covering a whopping 1.1 billion bushels. That could provide fuel for short covering rallies if weather threatens.
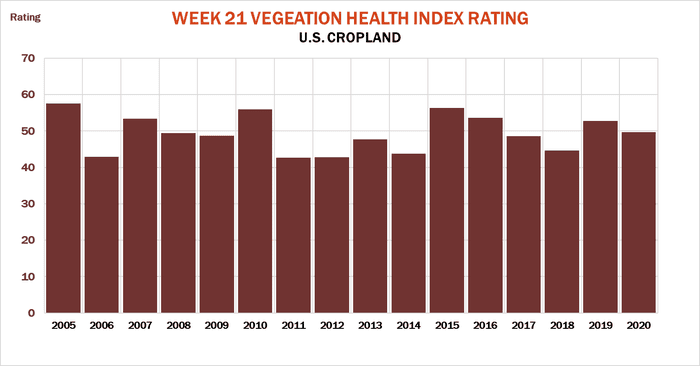
Vegetation health. Traders increasing use satellite-based imaging to assess conditions. The Vegetation Health Index published weekly by NOAA’s Center for Satellite Research and Applications tracks development of the crop. Statistically significant correlations with final corn yields begin showing up on these readings at the end of June, with the best fits from mid-July to the end of August.
Weekly U.S. VHI ratings cover all cropland, but still show a good fit for corn, especially with key Midwest states.
This year: The latest VHI readings suggest the crop off to a decent start, though the U.S. rating for the end of May of 50 is about average. Illinois is doing the best of the “three I” states, with Iowa average and Indiana below average, reflecting drier conditions in the west and problems with cool weather in the east.
Acreage. The next key data benchmark from USDA for the market will be the agency’s June 30 acreage estimates. On average farmers wind up planting a little more corn than March intentions, with the best gauge for changes coming from planting progress. Changes can also reflect swings in claims for Prevent Plant crop insurance coverage. Historic flooding a year ago caused farmers to claim Prevent Plant on a record 11.4 million corn acres.
This year: History provides a mixed outlook. Fast planting suggests growers might keeping planting corn, perhaps adding 425,000 to the 97 million reported in March. But with crop insurance offering some growers a lifeline again this year, Prevent Plant claims could knock 750,000 acres off early intentions. Either way, with a large surplus of old crop corn, changes don’t look like they’d be big enough to move the market unless weather threatens yields.
Knorr writes from Chicago, Ill. Email him at [email protected]
The opinions of the author are not necessarily those of Farm Futures or Farm Progress.
About the Author(s)
You May Also Like


