U.S. corn growers enjoyed an unexpected counter-seasonal rally in August and September. The 79.25-cent jump off Aug. 12 lows was one of the largest on record following release of USDA’s first monthly production estimate, topped only by December futures gains in 2006 and 2010.
Futures kept up the bullish momentum into the following winters in both those years. But a look back through the data shows the hurdles corn faces in the months ahead if it expects to lift prices. Without a sharp cut in USDA’s production estimates, end users may be unwilling to pay higher prices due to burdensome U.S. supplies.
The 2006 and 2010 rallies took place in a corn market where projected supplies leftover at the end of the market years were less than half today’s surplus.
In 2006-2007, for example, production wound up 4% less than the government’s August guess. Demand also looked like it would improve thanks to strong exports, though price rationing by end users ultimately held down consumption after a move to the highest level in more than a decade.
The 2010-11 rally took July 2011 futures within a tick of $8, after August production fell 5% and ending stocks threatened to drop below 1 billion bushels, even with apparent price rationing.
USDA’s Sept. 11 estimates supported the initial 2020 rally, knocking 2.5% off the size of the crop. Weekly ratings suggest more production cuts could be in the offing in coming months. But that’s the quandary too, because rallies could dampen demand that looks crucial to whittling away the still-large U.S. surplus that could top 2.5 billion bushels by the end of the marketing year in August.
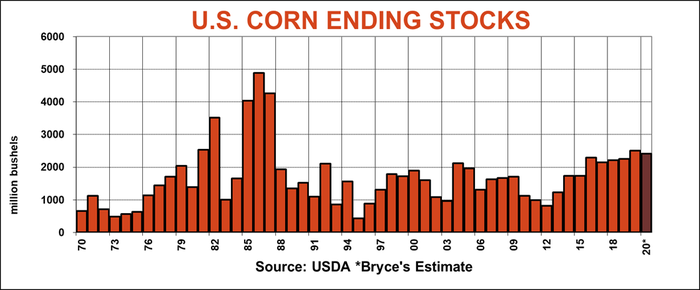
To be sure, total U.S. corn demand should approach record levels in 2020-21. But with more than 2.2 billion bushels left over from the 2019-20 marketing year, additional supplies from one of the largest crops in history could put buyers in a “prove it” bargaining position.
Here’s a look at the three legs of U.S. corn demand as the 2020-21 marketing year concludes its first month.
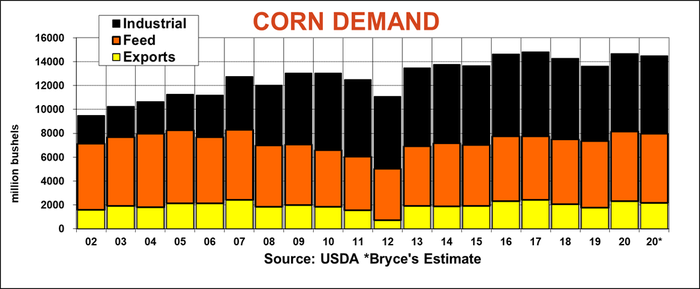
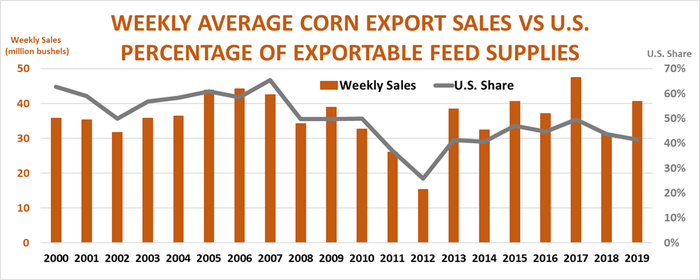
Exports garnered the most attention from bulls, thanks to a buying surge out of China and predictions from USDA for total sales to all customers to be the fourth highest on record. But even the China card may not be enough.
China is supposed to allow imports of 283.5 million bushels of corn per calendar year under low Tariff Rate Quotas, according to World Trade Organization commitments. Imports beyond that are slapped with a 65% tariff unless the government allows waivers. USDA projects total marketing year imports will approach the TRQ target in both 2020-21 and the 2019-20 marketing year that ended Aug. 31 thanks to declining Chinese corn inventories.
U.S. exports to China hit 210 million bushels in 2011-12 as China’s livestock sector boomed. But a long-term deal with Ukraine signed in 2012 and increased production by Chinese farmers shut the flow of grain from the U.S. long before the trade war rumbled. Chinese purchases of 2019-20 crop Ukrainian corn outpaced those from the U.S. by more than a 6 to 1 margin, according to data from the China Customs Bureau released over the weekend.
U.S. 2019-20 crop corn shipments to China totaled just 83 million bushels and only 2 million of those came after the first of the year. Chinese purchases of U.S. corn jumped after the phase one trade deal came down, with total 2020 calendar year commitments near 470 million bushels. But most of those sales have yet to be shipped, so it’s uncertain how many might be rolled to 2021 crop delivery, or perhaps cancelled altogether if relations between the two superpowers continue to sour.
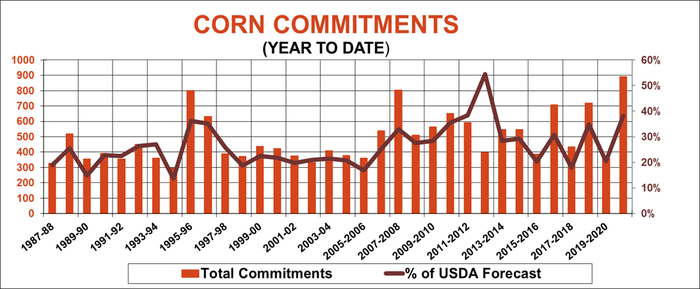
Corn sales and shipment totals early in the marketing year, though a record so far, don’t correlate well with how final shipments turn out at the end of the following August. The best indicator of potential is how much corn and other feed grains the U.S. has to export compared to its main competitors. While Ukraine and Argentina are expected to offer less, Brazil and Russian should have more grain to put on the world market, though the crop in the southern hemisphere won’t be harvested for until mid-2021 and both countries traditionally sell little to China directly. Even under the best-case scenarios, total U.S. corn exports could fall 75 million bushels short of USDA’s aggressive export target of 2.325 billion without Chinese intervention.
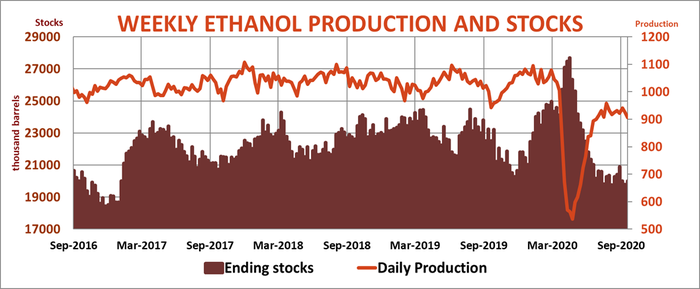
Corn usage to make ethanol looks set to recover from a disastrous 2019-2020 campaign, when processor margins were already in the red even before the pandemic hit. Demand for blending with gasoline should slowly recover as the economy heals, though total food, industrial and seed usage should remain below levels seen in 2017-18 and 2018-2019. As a result, don’t look for biofuels to come to the rescue.
Demand from livestock feeders could be the best in more than a decade. But this sector tends to be the most sensitive to prices of any of the triad. Corn values account for more than 80% of the variance in feed demand because livestock producers are adept at finding the least-cost ration. That’s particularly true as the industry recovers from disruptions caused by the pandemic.
Feed demand is an equation with two factors: The number of critters and how much they eat. USDA publishes an index of “grain consuming animal units,” a 50-year-old calculation that compares demand from cattle, poultry, hog and other livestock operations to the corn consumed by a diary cow. Each of the three sectors – dairy/beef, pork and poultry – accounts for about a third of the animal mouths to feed.
The number of GCAUs hit a record during the 2019-20 marketing year as producers revved up to meet demand from a strong economy and the China trade deal. But on-going weakness in cattle feeding profitability and a flood of red ink from COVID-19 slaughterhouse closures clouds the outlook for expansion in 2020-21.
The 2020 calf crop looks like it will be down for the second straight year, and placement of steers in feedlots has only begun to cover from the sharp downturn in March and April. Last week’s hog inventory numbers also suggest lower pork production, though those numbers were collected before hog prices surged following news of swine fever in Germany. 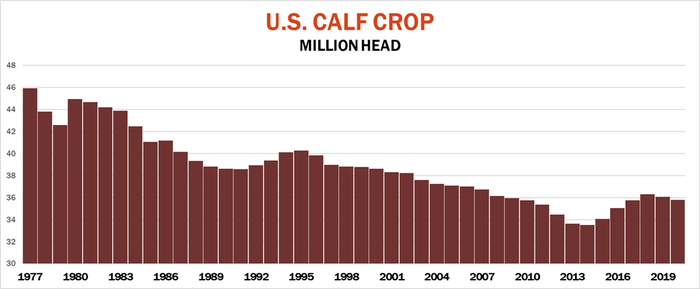
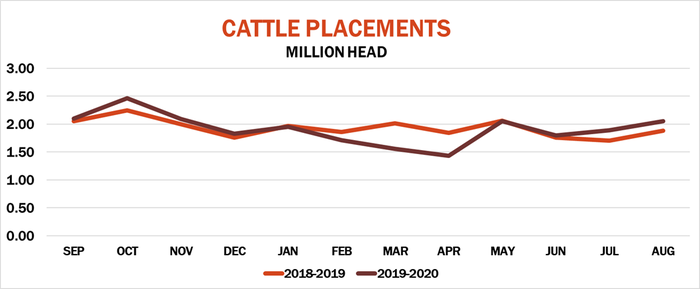
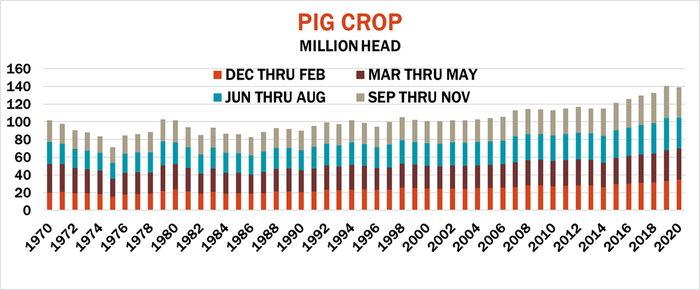
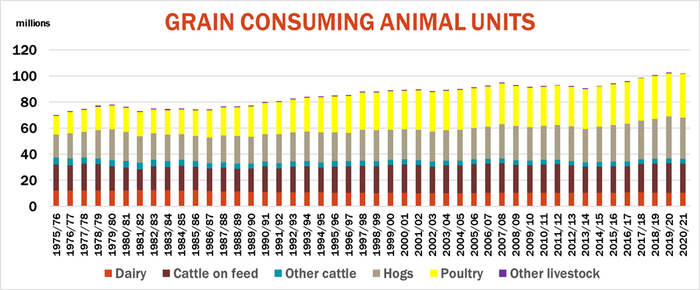
These question marks suggest USDA may be too high on its forecast for feed usage, though the total should still be strong.
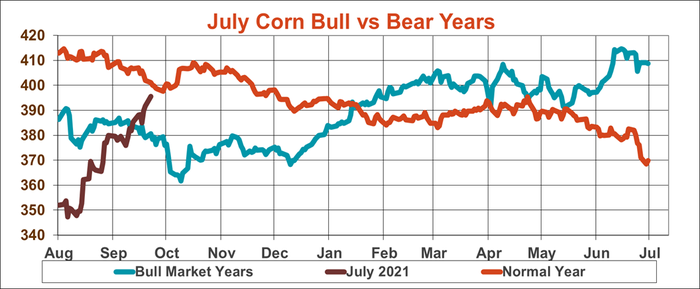
What does all this mean for prices? With plenty of corn expected to be on hand this year, rallies at best may be slow but steady if traders get a regular dose of supportive news, starting with Wednesday’s quarterly stocks report. Most of the time, July futures get a brief bounce into harvest then turn lower through the end of winter before a modest rebound into the following growing season. In bullish years, December lows hold harvest lows, helping spur better winter rallies.
But producing big rallies like those seen in 2006-07 and 2010-2011 may be asking too much for the corn market of 2020-21.
Knorr writes from Chicago, Ill. Email him at [email protected]
The opinions of the author are not necessarily those of Farm Futures or Farm Progress.
About the Author(s)
You May Also Like


