
Subscribe to receive top agriculture news
Be informed daily with these free e-newsletters
October 27, 2011
Corn and soybean prices that result in $50,000 of net farm income are estimated for a 1,200-acre farm in central Illinois. A corn price of $3.70/bu. and $8.51/bu. for soybeans results in $50,000 of net income on a grain farm that purchases crop insurance and owns 15%, share-rents 45% and cash rents 40% of its farmland.
Farm situation
The $50,000 benchmark net farm income roughly represents the average farm income during the late 1990s and early 2000s. During this period, many farms were “holding their own” financially, with some farm s having deteriorating financial positions. Given today’s cash flows, a $50,000 net farm income would result in financial deterioration on many farms.
Parameters of the farm are set to be typical of a grain farm in Illinois. The farm has 1,200 acres with two-thirds planted to corn and one-third planted to soybeans. Corn yield is 190 bu./acre and soybean yield is 55 bu./acre. Non-land costs are $515/acre for corn and $300/acre for soybeans and represent values approximately equal to costs in 2012 Illinois Crop Budgets (see table).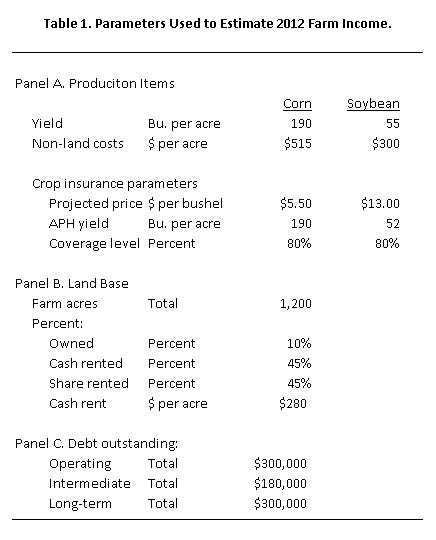
The farm purchases revenue protection (RP) crop insurance at the 80% coverage level. The actual production history yields are 190 bu. for corn and 52 bu. for soybeans. Projected prices are set at $5.50 for corn and $13 for soybeans, anticipating these price levels for futures contracts during February 2012.
There are 1,200 tillable acres, with 15% owned, 40% share-rented and 45% cash rented. These values are typical for grain farms in central Illinois. The cash rent is $280/acre (see table).
Debt outstanding is $300,000 for operating notes, $180,000 for intermediate debt and $300,000 for long-term debt. In determining prices, soybean price is kept at 2.3 times the corn price.
Commodity prices resulting in $50,000 net farm income are $3.70/bu. for corn and $8.51 for soybeans. Crop insurance is needed to have these breakeven commodity prices. If crop insurance is not purchased, commodity prices resulting in $50,000 net farm income are $4.03 corn and $9.27 soybeans. Significantly lower projected prices of $5.50 for corn and $13 for soybeans used in determining crop insurance guarantees will increase necessary commodity prices to obtain $50,000 of income.
Chicago Mercantile Exchange futures prices for harvesttime contracts are near $6 for corn and $12.30 for soybeans, suggesting cash prices substantially above levels that would generate $50,000 of incomes. At this point, futures prices point to strong 2012 income, given that costs and yields are near expectations.
While 2012 farm incomes are projected to be positive, commodity prices resulting in $50,000 are within the realm of possibility. Several years of above-average yielding years in the U.S. or around the world could result in near $4 corn and $9 soybean prices. Destruction in demand could also yield prices in this range.
Also note that the $3.70 corn and $8.51 soybean prices are well above prices that occurred prior to 2006. Between 1975 through 2005, corn prices averaged $2.40/bu. for corn and $6.10/bu. for soybeans. Commodity prices near these levels would cause financial stress today.
Differences in rental arrangements also impact commodity prices necessary to generate $50,000 net farm income. Higher levels of share rent lower prices while higher levels of cash rents increase prices. If the farm has 85% share rent and no cash rent, crop insurance purchases will guarantee the farm at least $50,000 of net farm income. If the farm has 85% cash rent and no share rent, commodity prices resulting in $50,000 of net farm income are $3.72/bu. for corn and $8.56 for soybeans.
Farms that have all cash rent farmland without owning or share-renting farmland will have higher breakeven prices. Take the above example farm, but have it cash rent 100% of its farmland. At the same time, eliminate $300,000 of long-term debt, which is presumed to finance a land purchase. In this case, a $4.41 corn price and $10.17 soybean price generates $50,000 net farm income. Increasing the cash rent amount results in the following break-even prices:
$4.42/bu. for corn, $10.17/bu. for soybeans given $280/acre cash rent
$4.65/bu. for corn, $10.70/bu. for soybeans given $320/acre cash rent
$4.89/bu. for corn, $11.25/bu. for soybeans given $360/acre cash rent
Summary
For a typical farm, $3.70/bu. corn and $8.51/bu. soybeans will generate $50,000 of net farm income. The rental situation of the farm has a large impact on these breakeven commodity prices. Renting more farmland using cash rental arrangements and having higher cash rents will increase break-even commodity prices.
Current commodity prices suggest that 2012 will be a profitable year. In the future, commodity prices close to those presented in this paper are likely to happen.
You May Also Like
Enter a zip code to see the weather conditions for a different location.


