USDA has released details of payments growers will receive under the 2017 ARC-County farm program, and as expected, fewer farmers are getting checks and those that do will be paid less.
That’s especially true for corn and soybean farms enrolled in the program. Benchmark prices for corn fell from $5.29 the first two years of the five-year farm bill to $3.95 for 2017. For soybeans the guarantee dropped from $12.27 to $10.86 for 2017. As a result, growers receiving payments for 2017 likely suffered yields losses in order to qualify.
Wheat benchmark prices held fairly steady the first three years of the program before dropping to $6.12 for $2017. With the national average cash prices for the 2017 crop falling to $4.72, more growers qualified for ARC payments even if their yields held up.

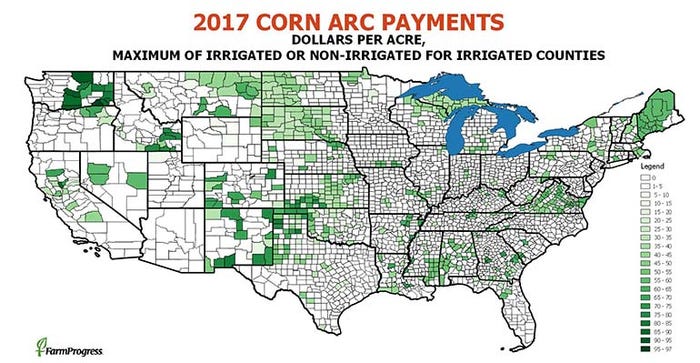
For corn, around 31% of counties received payments averaging around $37 an acre. That compares with the approximately 80% that were eligible in 2016 and received $59 an acre on average.
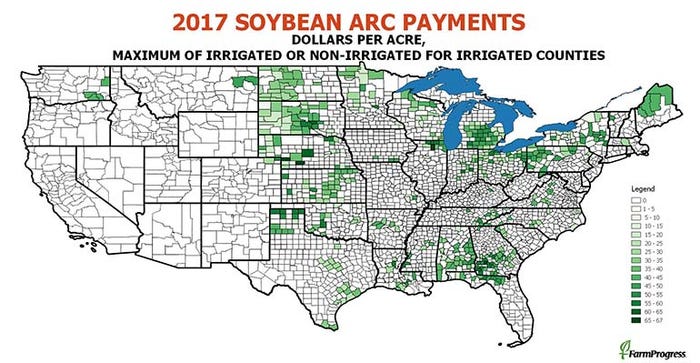
ARC-County paid off better on corn than soybeans, which was the consensus among analysts studying the program early on. While a slightly higher percentage of soybean counties received payments for the 2017 marketing year, around 34%, the average check for those getting payments will run around $26.50. Some 41% of counties got a payment on soybeans for 2016, with the average $34.

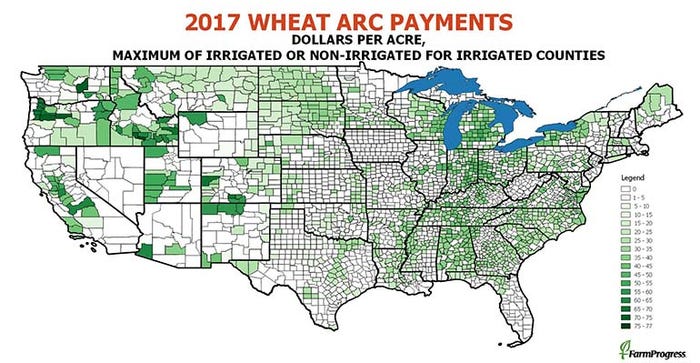
Fewer wheat growers signed up for ARC-County, choosing Price Loss Coverage instead. Around 63% of wheat counties received a payment for 2017, with the average at $27. Some 88% of farmers got ARC checks for 2016 crop wheat that averaged $35 an acre.

In addition to county-level maps for all three crops, we’ve prepared interactive maps showing how 2017 payments were calculated for counties with and without irrigation. Click the box in the upper left hand corner of the interactive maps to bring up a legend; unclick the boxes in order to bring up the map you’re interest in: all yields, irrigated or non-irrigated.
About the Author(s)
You May Also Like


