
Even if your only encounter with The Bard of Avon was back in sophomore year of high school, you likely still remember Shakespeare’s warning to Julius Caesar. This year you don’t need to beware March 15, but your risk management plan certainty needs to be aware of it.
In addition to the usual crop insurance deadline in many states, the middle of March is also the final date for 2021 farm program signup. Choices made at the start of the current Farm Bill for 2019 and 2020 can be changed annually for the last three years of the law. And even if you’ve already enrolled and selected your crop insurance coverage, figuring how these programs fit into your marketing plan is a crucial chore before the real work of planting begins soon.
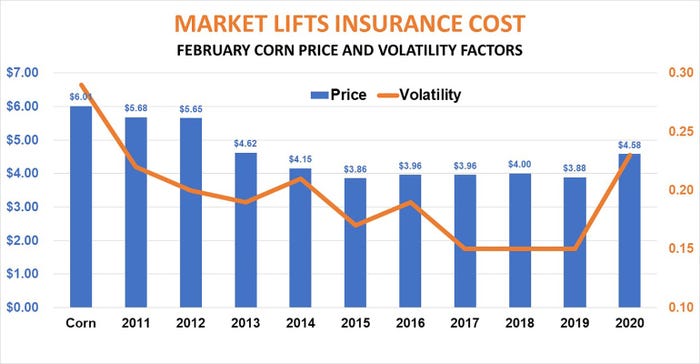
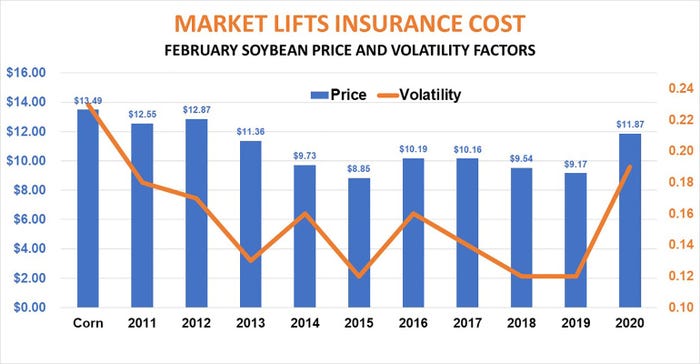
Corn and soybean growers chose Revenue Protection on 92% of their 2020 acres, and that popularity likely will hold this year too. Spring prices were established Friday with the close of February futures trading, and they’re the best in years. Corn’s projected $4.58 price is the highest since 2014, while the soybean value of $11.87 is the most since 2013.
Rip-roaring markets this winter will increase prices of the popular insurance products compared to last year, at least a little. One factor that goes into premiums is market volatility, which is derived from options prices. The 23% volatility factor for corn and 19% for soybeans are the highest in a decade.
On the face of it those prices seem to offer farmers something they haven’t seen in March for years: Revenue guarantees that are very close to locking in a profit with average yields and costs.
Farm program alternatives provide further protection. Farmers were mixed in their use of ARC and PLC during the first two years of the program. With prices low back then growers enrolled in PLC on 76% of corn acres, with ARC-County taking another 19%. That choice appears to have paid off. The 2019 average cash price of $3.56 earned at least a 14-cent payment, even if the reference price of $3.70 isn’t in play for 2020.
ARC made payments only for those who suffered yield losses in both years for both crops. The $8.40 soybean reference price held in both years so PLC didn’t earn a payment. Farmers mostly planned for that outcome: 80% took ARC for 2019 and 2020, with only 14% opting for PLC.
For 2021, new crop futures put soybean cash prices $3 or more above the reference price. New crop corn has less of a cushion, but still would have to fall significantly to dip below the reference price again.
There’s no one-size-fits-all rule for any of these choices. For starters, each farm’s PLC yields are different, and some owners may not have updated their data when given a chance last year. Crop insurance yields are also different from farm to farm. Moreover, each farm’s tolerance for risk varies too.
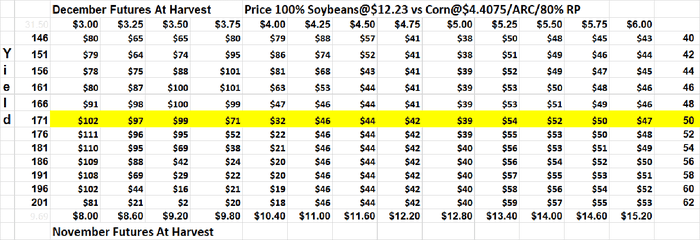
I ran simulations on different strategies for insurance and farm program choices, assuming sales were made at Friday’s closing prices: $4.7075 for December corn futures and $12.23 for November soybeans. Here’s what the analysis showed.
ARC vs PLC
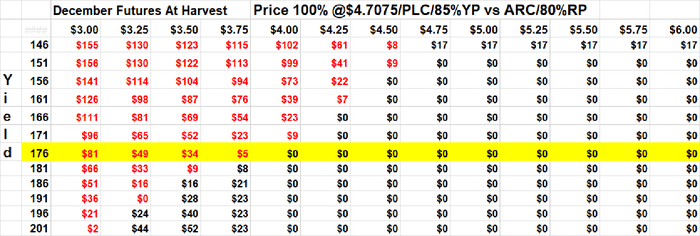
ARC-County beat or tied PLC for corn if harvest futures prices are above around $3.50 and yields are average or worse. The combination of lower yields and prices produced enough revenue loss to trigger an ARC payment while PLC paid little or nothing.
PLC topped ARC if prices were low, regardless of yield.
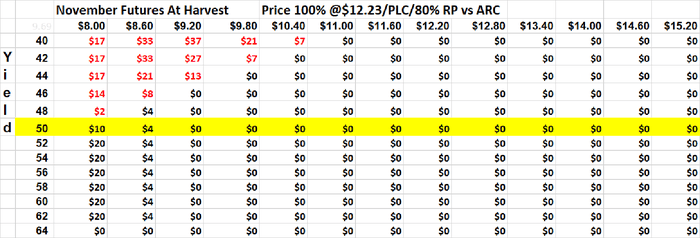
For soybeans, PLC payments were the same or higher than ARC if yields were average or better and prices fell below the reference price. If prices and yields both fall, ARC has a better chance of producing payments.
Some university simulations based on historical yield tendencies show PLC beating ARC for corn on average. Fast-moving markets, however, make this type of forecasting difficult.

Revenue Protection vs Yield Protection
My analysis assumes growers take 80% Revenue Protection, which is about average. I contrasted this with an 85% Yield Protection for corn policy coupled with PLC. YP pays off on falling yields only, while lower prices trigger payments for PLC. The combination topped Revenue Protection and ARC, which both protect revenues, only if prices fell but yields were better than average.
Corn vs Soybeans
I looked at two alternatives for comparing corn and soybean profit potential. Both assume RP at 80% and ARC are selected.
Doing nothing and waiting for the harvest price was better for soybeans if prices and yields both are low or if yields are better than average and prices don’t collapse. But doing nothing on either crop has potential for red ink.
By contrast, pricing 100% of production at current prices pretty much assures a profit. With the new crop soybean to futures ratio around 2.6 to 1 – favoring soybeans – selling at current soybean prices beats corn under all the scenarios considered.
The drawback to this analysis is that it assumes yields and prices move the same for both crops. That’s a big if, to be sure. Predicting how average cash prices will correlate to futures is also perilous. This is yet another reason for doing your own stress test based on the particulars of your business’s unique characteristics. Even with market’s hot, there’s risk from inaction, as well as action.

Knorr writes from Chicago, Ill. Email him at [email protected]
The opinions of the author are not necessarily those of Farm Futures or Farm Progress.
About the Author(s)
You May Also Like


