Several weeks ago we took a look at demand for U.S. soybeans and came to the conclusion the first order of business in slowing consumption might come from domestic soybean meal use, via higher soybean meal prices – in other words, rationing.
With the USDA Outlook Forum projecting a record tight stocks-to-use ratio in its first go-around for the 2021/22 crop year of 3.2% or just 145 million bushels of ending inventory, now might be a good time to revisit where the market stands.
Record export pace
First, soybean exports continue on a record fast pace. USDA did acknowledge this in the February WASDE by upping its export forecast by 20 million bushels and reducing carry-out a corresponding amount to 120 million bu.
Unlike the three prior years when export forecasts were gradually revised lower during the initial 10 months of estimates, the reverse has been true this year, as the forecast has risen 200 mbu between May 2020 and February 2021, to 2.250 billion.
The market has been alluding to this since last September when March Beans surpassed the $10 per bushel mark, driven by unprecedented Chinese buying. Year-to-date export sales to all destinations have steadily risen to an all-time, mid-February high of 2.203 bbu (billion bushels).
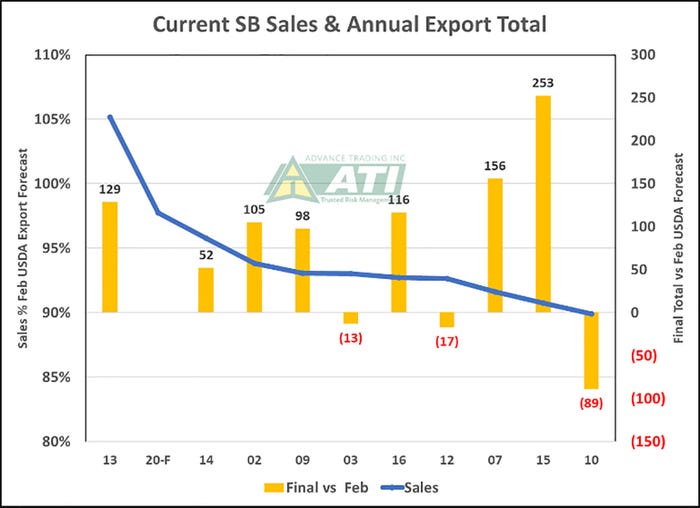
The above represents 98% of the February export forecast, a level which has been exceeded only once in 35 years, when the ratio hit 106% in the 2013/14 campaign. Actual shipments have naturally been on the same course, up nearly 80% year-to-year.
Doing the math indicates balance of the year shipments need only total 350 million or so to reach the forecast. The last time exports in the last half of the year were that low was back in 2014/15 (351 million). To give you an example of “typical” March-August export demand for U.S. soybeans in recent years, the 5-year average has been 670-plus million, with a low of 590 and a high of 800-plus.
But how does the sales picture stack up to the remaining expected export demand? One can look at this in a couple of ways:
unshipped sales as of last week stood at 305 million which is 130 million, or 70% more than were on the books a year ago;
how many new sales are needed?—last year required 440 million in subsequent sales; only 47 are needed this year. So, buyers are well covered, needing only a minimal amount of new buying to reach the export goal.

The graph ranks YTD (year-to-date) sales as a percentage of the February WASDE forecast (blue line, left vertical axis) for the top 11 out of the past 21 years; in other words, those years in which the percentage was the highest. This year, 20-F, is second only to the 2013/14 year, as noted above. The right-hand vertical axis indicates by how much the final export total increased (+) or decreased (-) vs the February forecast. In 8 out of the 11 years shown, the final export total came in an average of 114 million bushels larger, while in 3 years, that total ranged from 13 (03/04) to 89 (10/11) mbu lower. This year “appears” to fall in the range of exports being “50-100 million bu. underestimated,” barring some rather major cancellations between now and fall as buyers opt for Brazilian supplies.
But, how about South America?
Record Brazil crop, estimated at 133 million metric tonnes which might get a little larger but is plagued by a late harvest, rains and perhaps more than the usual amount of quality issues;
The Argentine crop is currently pegged to about 5 MMT smaller this year with dryness an immediate concern and some see the crop shrinking a bit;
Add in Paraguay and the net of everything is South American “supplies” are likely to be about 5 MMT less.
So, if all goes like last year, recalling the U.S.’s record fall export program and fast forwarding ahead, we could very much see the same scenario in the fall of 2021. But without a 525 million bushel cushion to begin the U.S. 21-22 marketing year.
Soybean meal demand: domestic
Since our last report, we did some further work on demand. As for the domestic side, October-December (current available data) use has been most impressive as it is up 4 1/2% versus 2019/20 which is well ahead of the more modest 1.5% annual increase forecast by the USDA. While cash meal prices are about 12% higher than they were a few months ago, this is likely to do no more than reduce annual meal consumption by about ½% if meal prices stay around $420 per short ton, basis July. Or, take 6 mbu off the crush from now to the end of August.
Soybean meal demand: export
The one area where rationing does appear to be taking place is in the export market. Let’s preface that by noting exports over the past month are very close to the highest on record, leaving the U.S. at the rate of nearly 300,000 metric tonnes per week. However, a variety of factors have served to reduce Argentina’s Sep-Dec crush by over 20% year-to-year, driving demand to the U.S. while tight year-end soybean supplies have also limited Brazil’s ability to crush and export meal.

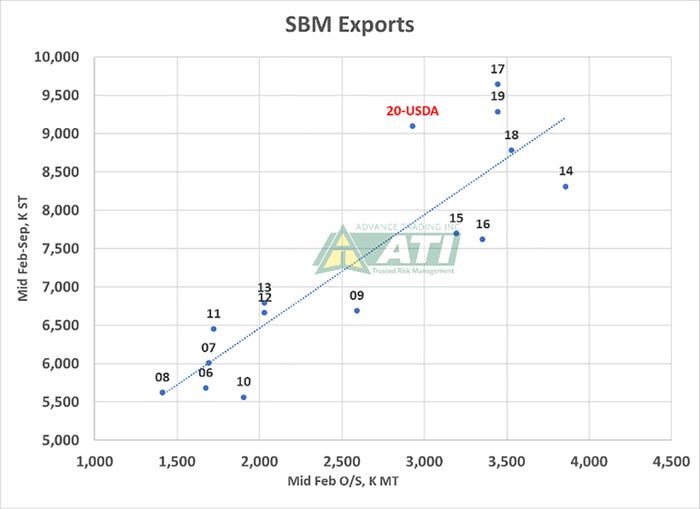
With new crop South American meal supplies soon to be available, unshipped U.S. meal sales are 15% below last year and at a 7-year low. The chart (SBM exports) plots current unshipped export meal sales (horizontal axis) with actual/forecasted exports for the remainder of the year.
The USDA forecast (“20-USDA”) is considerably above the “trend line”, suggesting crush could be as much as 40 million bushels over-stated.
What’s the bottom line?
The volatility the market has seen the past few months in old crop soybeans does not appear to be over just yet. We appear to be oversold on export soybeans; domestic soybean meal demand continues to run well ahead of USDA projections with only export meal showing signs of backing off.
The one left hook? Chinese hog AND meal prices have been eroding lately and some are saying this is may be the result of ASF and other disease issues.
Contact Advance Trading at (800) 664-2321 or go to www.advance-trading.com.
Information provided may include opinions of the author and is subject to the following disclosures:
The risk of trading futures and options can be substantial. All information, publications, and material used and distributed by Advance Trading Inc. shall be construed as a solicitation. ATI does not maintain an independent research department as defined in CFTC Regulation 1.71. Information obtained from third-party sources is believed to be reliable, but its accuracy is not guaranteed by Advance Trading Inc. Past performance is not necessarily indicative of future results.
The opinions of the author are not necessarily those of Farm Futures or Farm Progress.
About the Author(s)
You May Also Like


