Monday’s supply and demand reports for corn and soybeans weren’t expected to provide much in the way of surprises, and they didn’t. Forecasts for both got tweaked as a result of acreage and stocks data reported June 30.
Otherwise, the only real headline news came in wheat, where the government released its first estimate of durum and spring wheat production, crops devastated by the drought on the northern Plains. Minneapolis futures paced the wheat complex higher, with gains spilling over into corn and soybeans after last week’s hemorrhage.
Wheat’s coattails may help stabilize corn and soybean futures for a bit, but aren’t likely to distract traders from their main obsession during the summer: the size of 2021 crops. The next milestone in that debate comes Aug. 12, when USDA releases its first survey of grower estimates. Monday’s update continued to use so-called “normal” yields of 179.5 bushels per acre for corn and 50.8 bpa for soybeans. As I mentioned last week, June precipitation, while historically dry in a few states, overall didn’t meet the threshold across key states that would have caused an adjustment before the August survey.
Weather forecasts continue to point towards more of the same: warm and dry in the northwest part of the Corn Belt, with more moderate conditions elsewhere. American models see more widespread heat and less moisture than European runs over the next two weeks, but long-range maps into the end of August remain fairly benign. Changes in Vegetation Health Indexes for corn and soybeans continue to track the trend from weekly Crop Progress reports, though the VHI for corn remains substantially below my forecasts based on crop ratings and weather forecasts. Monday’s condition reports showed a slight uptick for corn with soybeans marginally improved after adjustments for state-by-state results.
So, USDA’s current “normal” soybean yield still seems in the ball park, while its corn number appears a little high. Barring big shifts in the data, history and price charts could provide clues about where markets are headed into harvest.
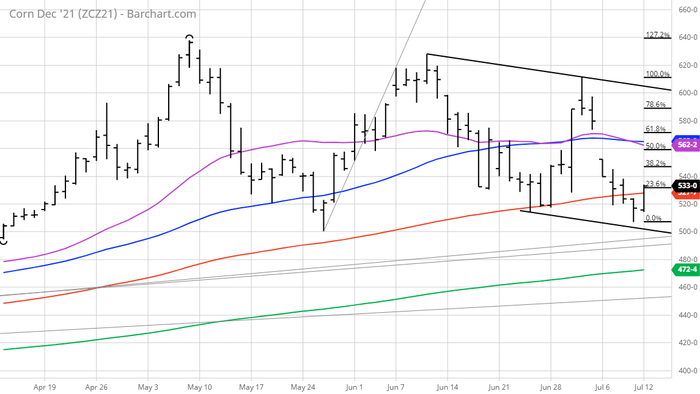
December corn’s chart is the more precarious of the two markets after last week’s selloff. The rebound off June 24 lows following bullish acreage news June 30 failed to get the market above its June high, which was below the May contract high. Futures remain in a downtrend after last week’s low took out the June low as well.
If December can hold, it still has plenty of heavy lifting to do. The break after Independence Day left a huge gap on the chart from $5.735 to $5.5225. The 25-day and 50-day moving averages lie in the middle of that range, with a bearish signal produced when the short-term average again moved below the longer one. Even a bounce to the 61.8% “Fibonacci” retracement of the July break wouldn’t close the gap.
To the downside, multiple trend lines come into play below $5 if the dike breaks.
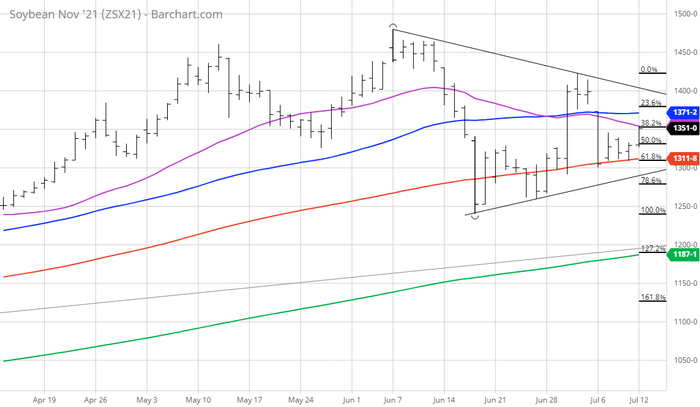
The November soybean chart isn’t so ugly, though the July rebound also failed to take out June contract highs and the same bearish moving average crossover as corn is evident as well. But July lows remain well above June lows and last week’s downturned failed to confirm a break below the 61.8% retracement of the July bounce. Overall, November shows a wedge pattern from a tightening price range. The first test for bulls is to close the Independence Day gap from $13.825 to $13.7325, then to take aim at the $14.23 July 1 high.
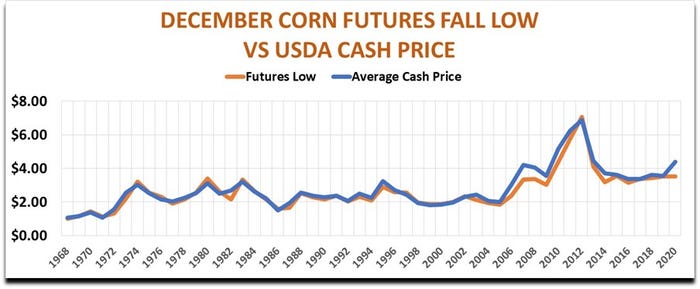
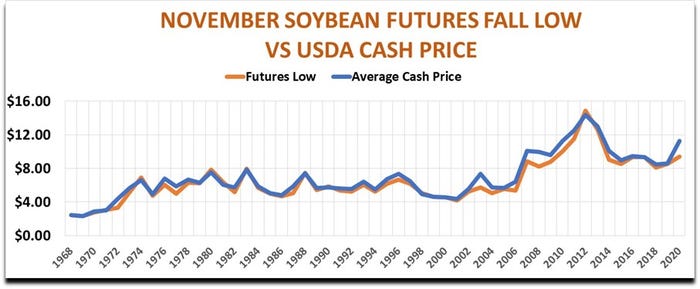
As far as the direction of the market through harvest, USDA average cash price forecasts hold some clues. There’s a strong correlation between futures’ fall lows and USDA’s estimate of farmer selling prices for the crop. USDA’s target accounts for around 95% of the variance with futures lows when more becomes known about production as combines roll.
This method of forecasting harvest lows isn’t perfect, because it looks at the government’s final cash price estimate made after the end of the marketing year. While most of the time the two prices are close, unusual years can cause a wider spread. That’s what happened last year, when forecasts for carryout dropped sharply from early estimates due to lower production and strong demand. But barring another year of surprises, the bottom line price forecast from July 12 reports could provide a starting point for bottom pickers.
Of course, there’s plenty of room for discussion on just what the average cash price will be. USDA put that benchmark for corn at $5.60, with soybeans at $13.70. These translate into projected fall lows of $5.24 for December corn, which closed at $5.33 Monday. The projected low for November soybeans is $12.73 – the contract closed Monday at $13.5125, suggesting downside risk ahead.
And USDA’s price forecasts could be too optimistic. My model puts the average corn price at $5.16, which projects to a futures low at $4.75. My current soybean average price of $12.72 would be big trouble for soybeans, pointing to a low at $11.91.
About the Author(s)
You May Also Like


