April 12, 2013

Story updated April 12, 2024
How much does agriculture contribute to the economy? Short story: Billions. Upon billions. When you total the cash receipts for all ag commodities, California is the leader, raking first with a total of more than $58 billion, according to USDA data. Rounding out the top 10 are:
California, $58 billion
Iowa, $44.7 billion
Nebraska, $31.6 billion
Texas, $29.7 billion
Illinois, $27.9 billion
Minnesota, $26 billion
Kansas, $23.5 billion
Indiana, $18.3 billion
North Carolina, $16.8 billion
Wisconsin, $16.6 billion
See the ranking of the full 50 states at the USDA ERS website.
Food-specific rankings
The United States produces many different agricultural commodities, food crops, meat and more. Here are the top five ranks for some of the most commonly consumed foods, including: apples, cattle, chicken eggs, sweet corn, food grains, fruit and nuts, hogs, potatoes, vegetables and melons.
Apples
Washington, $2 billion
Michigan, $412 million
New York, $343 million
Pennsylvania, $124 million
Virginia, $66 million
Cattle and calves
Nebraska, $13.7 billion
Kansas, $11.6 billion
Texas, $11.5 billion
Iowa, $5.2 billion
Oklahoma, $4.5 billion
Chicken eggs
Iowa, $1.9 billion
Ohio, $1.9 billion
Indiana, $1.7 billion
Pennsylvania, $1.2 billion
Texas, $1.1 billion
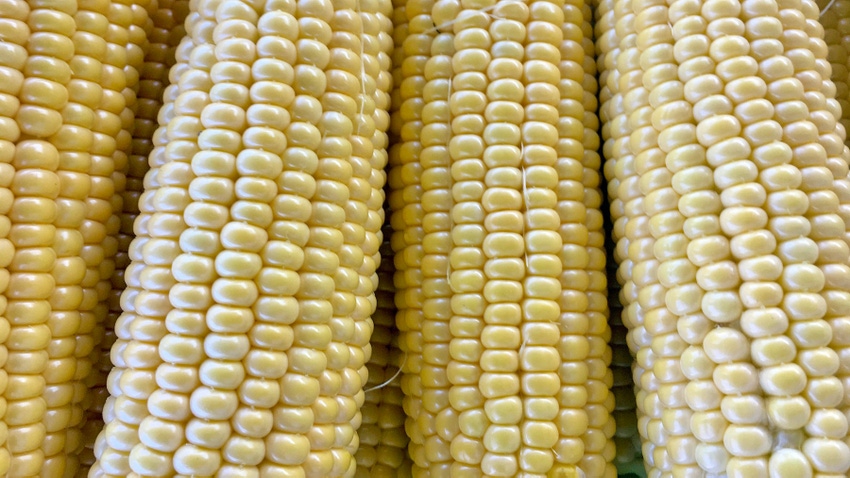
Sweet corn
Florida, $219 million
California, $177 million
Washington, $114 million
Minnesota, $112 million
Georgia, $106 million
Food grains (cereal seeds, mainly wheat and rice)
North Dakota, $2.1 billion
Kansas, $2.1 billion
Arkansas, $1.3 billion
Montana, $1.2 billion
California, $1.1 billion
Other ag crops
Aside from food crops, ag commodities including corn, soybeans and wheat make up billions in cash receipts, as well. These are the top five states for cash receipts, along with acreages, in those commodities.
Corn
Iowa, $15.3 billion; 13.1 million acres
Illinois, $13.6 billion; 11.2 million acres
Nebraska, $10.7 billion; 9.9 million acres
Minnesota, $8 billion, 8.6 million acres
Indiana, $6.4 billion; 5.4 million acres
Soybeans
Illinois, $9.5 billion; 10.3 million acres
Iowa, $8.7 billion; 9.9 million acres
Minnesota, $5.1 billion; 7.3 million acres
Indiana, $4.7 billion; 5.5 million acres
Ohio, $4.2 billion; 4.7 million acres
Wheat
North Dakota, $2.1 billion; 6.6 million acres
Kansas, $2.1 billion; 8.1 million acres
Montana, $1.2 billion; 5.2 million acres
Washington, $1 billion; 2.3 million acres
Oklahoma, $648 million; 4.5 million acres
Read more about:
Food ProductionYou May Also Like


