Think DifferentThere’s an old saying: “Pay attention to what you measure.” Today, measure liquidity ratios instead of paper wealth from land value appreciation and Section 179 tax deductions.While all of the ratios cited here are key to rating your financial health these days, the top three favored by Michael Langemeier, director of cropping systems and farm management specialist at Purdue’s Center for Commercial Agriculture, are:Operating profit margin ratioAsset turnover ratio, or Rate of return on farm assetsROI, or Return on investmentHe likes them because they are interrelated.One helpful online tool is table 5 athttp://www.farmdoc.illinois.edu/finance/benchmarks.asp.
January 3, 2014

As the heydays fade, cash is king. Track your liquidity with the same scrutiny that you do land prices. Out with net-worth thinking and in with operating-statement scrutiny. Out with (IRS code) section 179 tax deduction thinking and in with real profit and loss thinking.
Your land costs are probably locked in for this growing season, but examine these ratios and business-productivity measures that reflect your true financial health, not your paper wealth. Land-price appreciation is misleading because it does not pay the bills, says Michael Langemeier, director of cropping systems and farm management specialist at Purdue’s Center for Commercial Agriculture.
Here are concrete liquidity-related tools that reflect your bill-paying ability in leaner times.
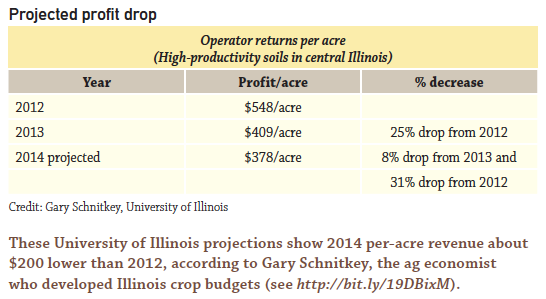
The average corn/soybean grower now operates at or near breakeven, based on corn and soybean price projections, notes Gary Schnitkey, University of Illinois farm-management Extension specialist. Corn prices in particular are falling more rapidly than are related inputs, he says.
Be sure not to incur debt on things having low payback, Langemeier advises. “Don’t use your precious working capital unless it makes you money.”
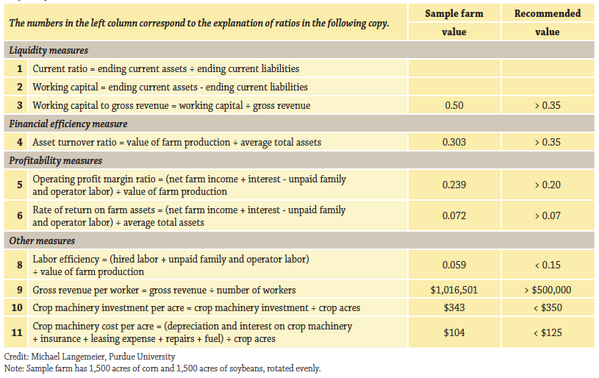
The farm-management Extension veteran focuses on whole-farm profitability benchmark measures in the table that follows. “Input expenses always merit scrutiny, but, for the most part, most farms already closely monitor these items,” Langemeier adds. “Labor-productivity and machinery investment ratios are high-priority considerations that lie within your control, but are often not as closely scrutinized as seed, fertilizer, and agricultural chemical costs per acre.”

Liquidity ratios to watch
This table below summarizes key financial benchmarking ratios, ideal target values, plus those for a representative 3,000-acre corn/bean operation in west-central Indiana.
Comments on ratios of particular interest include:
Ratio 3) The ratio of working capital to gross revenue measures the funds available for use if you sold all current assets and paid all your current liabilities, says Illinois Extension Management Specialist Gary Schnitkey. “This ‘marries’ the balance sheet (working capital figure) to the income statement (value of farm production figure) to arrive at a ratio that reflects your liquidity position relative to the size of the farming operation. The higher the ratio, the more liquidity the farm operation has to meet obligations or debts. The ratio varies by farm type, farm revenue, age of the farm operator and tenure,” Schnitkey says.
“If your ratio of working capital to gross revenue ratio is 0.60, then you have 60% of the year’s revenue in a very liquid position for your operation,” Schnitkey says. “This liquidity can provide cash to purchase operating inputs or make capital purchases. In 2012, the median Illinois farm business grain farm ratio was 0.68 for a group of grain farms in the Illinois Farm Business Farm Management (FBFM) database. For that same group of grain farms at the 75th percentile, the ratio was 1.04.
“Larger revenue farms with less owned land would see a potential doubling up of the signs that would point to lower levels of liquidity via the working capital to value of farm production ratio.”
Ratio 4) Asset turnover ratio, or Rate of return on farm assets:This ratio may keep you from fooling yourself with high capital gains from appreciated land values, Langemeier says. “If your earnings from operations aren’t high enough, you don’t have the money to buy new assets. Land gains are fine and dandy, but I want to see underlying earnings on investments.”
That said, this gauge of financial efficiency changes depending on what percentage of land is rented versus owned. Farms that rent relatively more crop acres would have a higher asset turnover ratio.
5)Operating profit margin ratio: “I like this ratio better than a net income farm ratio because this reflects labor and interest expense,” Langemeier says. Operating profit margins vary by industry. “For production agriculture, producers should shoot for a an operating profit margin ratio above 20%.”
6) ROI, or Return on farm assets: The return on farm assets can be computed by multiplying the operating profit margin ratio by the asset turnover ratio. This suggests that the rate of return depends on both earnings (represented by the operating profit margin ratio) and the efficiency utilization of assets (represented by the asset turnover ratio).
7 and 8) Labor efficiency and labor productivity ratios: Labor efficiency and gross revenue per worker vary tremendously from farm to farm, Langemeier says. If your labor efficiency figure is above 15%, “it doesn’t mean you need to change, but examine what you’re doing labor-wise.”
9 and 10) Machinery investment and machinery cost: In today’s environment, these two are very important. Machinery investment per acre should be below $500/acre, and preferably below $350/acre. For northeastern Kansas farms, the average was $300 per acre in 2012.
If your machinery figures are too high, what machinery do you need to operate, and what is optional? This is more important than tax-deduction thinking, Langemeier and Schnitkey say.
IRS Code Section 179 depreciation may have lowered your tax liability the past few years, perhaps at the expense of decreasing your working capital, Illinois’ Schnitkey says. “Now would be a good time to create a capital budget for the next five years to get the most 'mileage' out of your working capital.”
New farm technology is hard to assess for payback, over and above auto-steer, which has been shown to pay for itself, Langemeier says. “There is no easy answer for some of the new add-ons to planters and sprayers. The point is that in the current environment, the benefit and cost of each new technology needs to be evaluated.”
In general, look at these ratios on a whole-farm scale to be sure you don’t use more labor or assets per acre or per bushel produced than your peers. Further comparisons are available at many state farm management associations.
About the Author(s)
You May Also Like


