March 28, 2016

After six years of replicated trials (60 total site-years), would you believe the only soybean inputs with a positive return on investment (ROI) were foliar insecticides, an occassional seed treatment and an occassional foliar fungicide/insecticide combo?
The university researchers were surprised, too, during this United Soybean Board checkoff-sponsored trial. Seth Naeve, University of Minnesota agronomist who headed up this project, says the trials “definitely showed that the group of lower-priced pesticide products (insecticides, fungicides) delivered positive ROI, while the group of higher-priced, yield-promoting products (BioForge, Cobra, foliar fertilizer and nitrogen) delivered negative ROI.”
Naeve says these conclusions support the idea of yield protection, not yield enhancement, which supports why we don’t get these huge yield increases because we’re just protecting what yield we already have. “That supports a strategy of using these products on the right field areas, at the right time, to magnify your return on investment – to greatly increase the chances of a positive return on investment,” he adds.
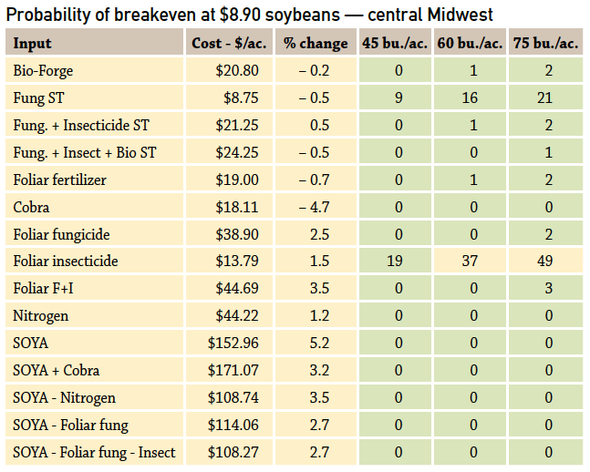
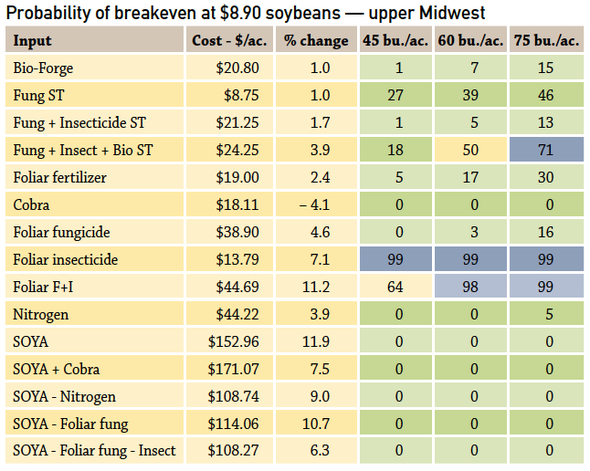
One look at these ROI charts on page 4 and you quickly see the lack of break-even probability among these inputs in low, average and higher yield environments (45, 60 and 75 bu./acre). The blue cells on the charts show strong probably of a profitable input, the yellow cells point to possible breakeven, and the remaining green cells indicate little chance of return. “The research showed more yield response with the expensive combination treatments, but the ROI wasn’t there to pay for them,” Naeve says.
Granted, Naeve says some of these 2013-2014 per-acre prices may be on the higher side (book value without quantity or early order discounts), “but these prices are a starting point and will help growers calculate which inputs are best for them in 2016 and beyond.”
Preventive insecticide use troubling
While foliar insecticide use or the combo with foliar fungicide provided 98 to 99% probability of break-even @$8.90 soybeans, these results trouble researchers. “This whole experiment was based on prophylactic or preventive application, not scouting and applying these products as needed,” Naeve says. “Unfortunately, that is how most farmers operate, as it’s cheap insurance to dump insecticide in with a second herbicide or fungicide application, and a lot of times it has some activity on pests. But that is NOT how pesticides should be used,” he says.
Naeve says this experiment is a little confounding in that it’s not quite real world. “If these sites got aphid infestations later, we had to spray an additional insecticide application across all plots to keep all yield results fair, but that may have skewed the foliar insectide results slightly,” he says. Even though the plots didn’t exceed aphid thresholds, they may have hovered in the near-threshold range (250/plant) for a while. “Bottom line is we do NOT recommend that upper Midwest farmers automatically go spray an insecticide at R3.”
An additional caveat is that dry versus wet years matter, too. “For example we didn’t see foliar diseases in the trials, so perhaps that’s why we didn’t see as big a response from foliar fungicides. In the wetter years, 2009-2011, we did see a larger fungicide ROI response. In 2012-2014, the response was less during these drier years,” Naeve says.
The best takeaway from this is that growers who truly scout and apply foliar insecticides and fungicides at the right time and location where issues exist, they would see even greater ROI than these research plots where we applied without regard to pest activity, Naeve says. “Whereas the yield-promoting products are recommended to be used ubiquitously and the response won’t change based on scouting, timing or field location.”
High populations not supported
In the population study, research did not show any reason why growers should change seeding rate when comparing average management versus high-input (SOYA) management. “On average, we could plant as few as 115,000 ppa which equated to about 74,000 to 78,000 harvested ppa. This final plant stand maximized yields in either the average or high management system. And this result flies in the face of the high seeding rate philosophy to obtain higher yields,” Naeve says.
Row spacing wins
Despite all these inputs, nothing showed a better, more consistent yield increase than narrow-row soybeans compared to 30-inch rows. “It’s not a popular topic among farmers who have gone the other way, back to 30-in rows. The reality is that 15-in. rows consistently deliver the most yield in the three years we tested this (2009-2011),” he says.
The study compared 30-in. rows with narrower row configurations, which varied among states but were all 20 in. or less. Researchers found an impressive impact. Comparing the most extreme treatments – the wide-row control plots versus the high-input, narrow-row soybeans (plots that had everything but the kitchen sink) – the study showed an average 6.9-bu. boost from high-intensity management.
But comparing wide-row/high-input plots to wide-row control plots narrowed the benefits of high-intensity management to a difference of 2.3 bu. That’s less than the boost seen from simply switching from wide to narrow rows without implementing any other inputs or management strategies, which bumped yields an average of 2.9 bu.
We first reported on this Kitchen Sink of inputs “Extreme Beans” research after the first 3 years of data had been analyzed in 2011 (visit http://usb-extremebeans.com). Research was conducted at the following universities: Minnesota, Wisconsin, Michigan State, Kansas State, Illinois, Purdue, Kentucky and Arkansas.
Active management improves success
This research represents an evaluation of true ‘Input-based Soybean Management”. “We were not attempting to identify best management practices, only products that provide value to producers in the absence of of an “Active Soybean Management” based approach,” Naeve concludes. Most products will have a better chance of success if managed more intensively – on a field-by-field basis.
Probability of input breakeven
These return-on-investment charts (upper Midwest is Minnesota, Wisconsin and Michigan; central Midwest is Iowa, Illinois and Indiana) show the lack of breakeven percentage of probability among these inputs in low-, average- and higher-yield environments (45, 60 and 75 bushels per acre). The blue cells show strong probability of a profitable input, the yellow cells point to possible breakeven, and the green cells indicate little chance of return in this six-year study.
SOYA seed treatments (ST):
Untreated control (UTC)
Fungicide seed treatment (Fung ST) - Acceleron® (45ml/100 lb)
Fung ST + Insecticide ST + Nematicide & Biological ST - AcceleronTM IX-409 (w/ Imidacloprid) (118ml/100 lb) + Poncho®/VOTiVO® (P/V) (59ml/100 lb)
Fung ST + Insecticide ST + Nematicide & Biological ST + LCO ST + LCO - AcceleronTM IX-409 (w/ Imidacloprid) (118ml/100 lb) + P/V® (59ml/100 lb) + Optimize® (83ml/100 lb) + RatchetTM (4oz/a at V4-V6)
Foliar and other treatments:
Nitrogen - 150 lbs. Urea (75 lb/a) w/ Agrotain (3 qt/ton) + ESN®(75 lb/a) @ V4
Defoliant - Cobra® (12 fl oz/a) @ V4
Foliar fertilizer - Task Force®2 (64 fl oz/a) @ R1
Antioxidant - Bio-Forge® (16 fl oz/a) @ R3
Foliar fungicide - Priaxor® (8 fl oz/a) @ R3
Foliar insecticide - Endigo® (4 fl oz/a) @ R3
Research project:
60 total site years
28 site-years showed significant yield increases
2012- 5 locations
2013- 11 locations
2014- 12 locations
North: 15 out of 21 (71%) responsive site-years
Central: 5 out of 18 (28%) responsive site-years
South: 8 out of 22 (36%) responsive site-years
Research collaborators
Input study led by graduate student John Orlowski (now at Mississippi State); and graduate student Eric Wilson (now at Pioneer DuPont) led the population trial.
Dr. Seth Naeve, University of Minnesota; Dr. Shawn Conley, University of Wisconsin; Dr. Kraig Roozeboom, Kansas State University; Dr. Chad Lee, University of Kentucky; Dr. Emerson Nafziger, University of Illinois; Dr. Shaun Casteel, Purdue University; Dr. Jeremy Ross, University of Arkansas; Dr. Kurt Thelen, Michigan State University.


About the Author(s)
You May Also Like


