June 24, 2020

Multiyear trends suggest that overall farm liquidity is slowly but persistently eroding. The share of Iowa farms that need short-term financing is rising. The share with strong liquidity positions is falling.
Data from mid- to large-scale farms collected by the Iowa Farm Business Association show 2019 accrual basis net farm income rose by 35% to $77,946. However, higher average income did not improve overall financial liquidity. Not only did the share of farms with vulnerable liquidity rise during 2019 compared to 2018, but working capital needs also climbed. Not all is gloom, however. While the share of farms with no liquidity problems shrank, working capital on those farms actually rose in 2019.
A look at overall liquidity
This article explores financial liquidity of Iowa farms using four indicators:
• the current ratio
• the annual change in working capital per acre
• the share of farms with less than $250 in working capital per acre
• the share of farms with vulnerable liquidity ratings
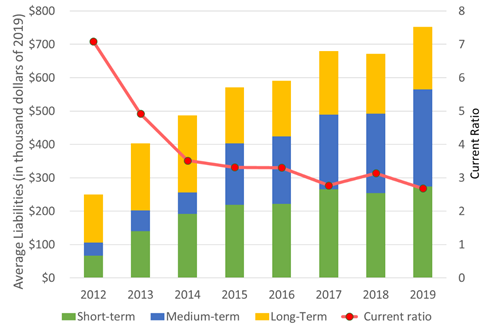
The average current ratio (current assets divided by current liabilities) for Iowa farms peaked in 2012 at 7.08. By 2017, it had tumbled to 2.77. It recovered to 3.14 in 2018, before sliding to 2.69 in 2019. On average, having $2.69 in cash, inventories and other liquid assets for each dollar of liabilities that will come due over the next 12 months might be considered a strong liquidity position. However, the trend is going in the wrong direction. That 2.69 is the lowest current ratio observed since December 2001.
Figure 1 shows that current, or short-term, liabilities rose by 8%, or $20,000, in 2019 to $274,088. Total liabilities climbed even faster. They rose 12%, or $81,256, from December 2018 to December 2019. Those figures are the averages of all Iowa Farm Business Association farms.
To understand the actual distribution of liquidity across farms, we calculated the share of farms with working capital per acre below zero and below $250 in each December since 2014. The share of farms with negative working capital rose almost uninterruptedly from 10% in December 2014 to 17% in December 2019. The share of farms with working capital below $250 per acre climbed from 23% to 34% over the same period.
We assigned the sample farms a liquidity rating of strong, vulnerable or normal based on their current ratio (CR) in December of each year. According to the Farm Financial Scorecard, a current ratio above 2 indicates a strong liquidity position. A ratio below 1.3 indicates a vulnerable liquidity position. Farmers with ratings in the 1.3 and 2 range are considered normal, but they still need to closely watch their liquidity. Those thresholds reflect all farms in the sample farms. Farms with frequent sales — think livestock — might operate with a lower CR.
Given the large number of farms in the sample with zero short-term debt, we added a fourth category of no current liabilities to the analysis. In December 2014, farms with strong liquidity or no current liabilities totaled 70.8% of the farms in the sample, while 16.8% of the sample were vulnerable. Five years later, in December 2019, the two top categories combined dipped to 61.6% of the total. The vulnerable share rose to 28.8%. Those figures say more farms are becoming vulnerable, and farms in strong financial positions are slipping.

The end of the agricultural boom gave way to rising farm debt loads and tightening liquidity positions.

Looking at working capital per acre rather than total working capital per farm can help address differences due simply to different sizes of farms. For farms keeping Iowa Farm Business Association records, working capital per acre declined $18 in nominal terms (not adjusted for inflation) during 2019. This loss was similar to the one observed in 2017, at $19, but much smaller than the $33 and $98 losses observed in 2016 and 2015, respectively. Only 2018 saw a rise in average working capital per acre, and it was a modest $2 per acre.
Liquidity in selected farms
A major drawback of comparing financial indicators across all farms in the sample through time is the variability of the sample size (declining from 565 farms in 2014 to 401 farms in 2019), and sample composition. The Iowa Farm Business Association has 348 farms with continuous detailed financial records since December 2016.
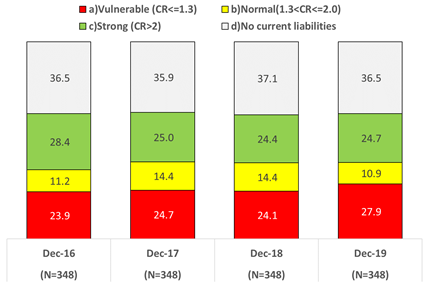
Looking only at those 348 farms mitigates the impact of a changing sample size over time. Figure 2 shows the share of those farms with vulnerable liquidity rose from 23.9% in 2016 to 27.9% in 2019. The share with strong liquidity declined from 28.4% to 24.7% over the same period. Note that the qualitative results derived from the stable subset of farms are similar to those obtained with the full sample.
On average, working capital among the 348 selected farms fell $19.50 per acre in 2017, gained $20.20 in 2018 and fell $30.70 in 2019. The group of farms with vulnerable liquidity is growing. Their working capital per acre declined by $15.50 per year between December 2016 and December 2019. That measure improved for the other three categories.

Combining the 36.5% of farms with no current liabilities with the 24.7% with strong liquidity suggests 61.2% of farms have solid short-term financial positions.

Resources to address liquidity issues
The erosion in farm liquidity is concerning and is a major contributor to stress in the farming community. Iowa Concern (800-447-1985) and COVID Recovery Iowa (844-775-WARM) are great sources for an array of confidential and 24/7 free-of-charge resources related to legal issues, finance, stress, crisis and disaster.
Developing a realistic cash-flow budget can help you better manage liquidity. Resources available at the Ag Decision Maker website can lead you through it (type “cash flow” into the search box at the top).
Read a full version of this article.
Plastina is an Iowa State University Extension farm management economist.
Source: Iowa State University Extension, which is solely responsible for the information provided and is wholly owned by the source. Informa Business Media and all its subsidiaries are not responsible for any of the content contained in this information asset.
About the Author(s)
You May Also Like


