Subscribe to receive top agriculture news
Be informed daily with these free e-newsletters

A new study challenges “top-down” estimates of livestock methane emissions with “bottom-up” data.
December 12, 2017
A new Penn State University study of U.S. livestock methane emissions challenges previous “top-down” estimates with “bottom-up” data. Serious discrepancies exist between the two. It comes down to which part of the scientific community is most accurate for future environmental regulatory policy.
Top-down vs. bottom-up
Top-down emissions estimates involve monitoring atmospheric methane concentrations by satellites or from air samples collected at high altitude by planes. Then the data is analyzed by computer models to estimate emission sources. The National Aeronautics and Space Administration has been one of the lead agencies on this assessment. The approach suggests U.S. EPA is underestimating agricultural methane emissions by up to 90%.
Bottom-up estimates take into account livestock populations and animal emission factors. They show much lower livestock emissions — the approach now accepted by the federal government. The study, partially funded by ExxonMobil Research and Engineering Company, pegged total U.S. livestock methane emissions at 19.6 billion pounds per year.
Penn State’s bottom-up emissions were analyzed by dividing the U.S. into GIS (geographic information system) cells from 31-square-mile cells in the northern U.S. to 42 square miles in the southern part of the country. Then, animal inventories and feed-intake-based emission factors were used to estimate enteric methane emissions for cattle and manure methane emissions for cattle, swine and poultry. Equine, sheep and goat emissions were considered negligible and not included.
And the bottom line was…
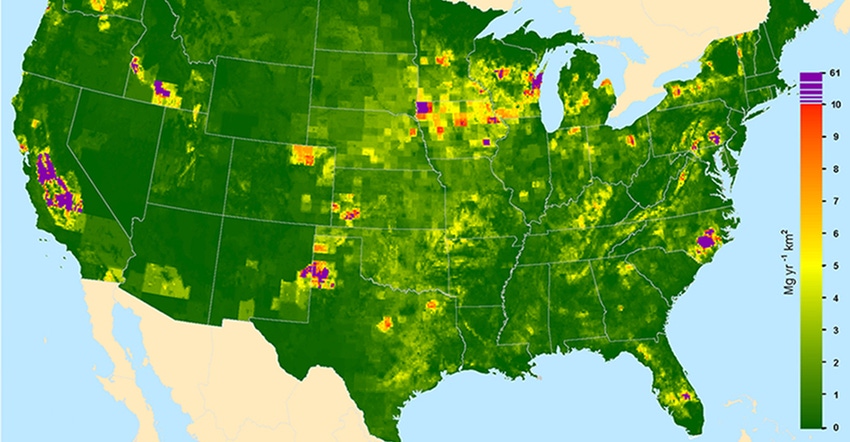
“EPA’s estimates are close to reality,” says Alex Hristov, lead researcher in the Penn State study. It also showed uneven spatial distribution (hot spots) of emissions. The largest hot spot areas (shown on the map) were in central California, eastern North Carolina, eastern Wisconsin, northwest Iowa, southeast Pennsylvania, southern Idaho and the Texas Panhandle.
“Our research also revealed a great discrepancy from global models such as the Emission Database for Global Atmospheric Research inventory," he says. Hristov, a dairy scientist, is a member of the current National Academy of Sciences Anthropogenic Methane Committee, part of the group leading the bottom-up research efforts. "We must have more specific information about methane emissions that combines local livestock populations and characteristics with distribution of landscape features,” he adds. “A gridded inventory approach provides that.”
County-level, annual enteric methane emissions for all states were estimated for beef and dairy cattle only. A total of 3,063 counties in the contiguous U.S. were included in the cattle database.
County cattle inventories came from the 2012 Census of Agriculture. Body weight data for cattle was derived from EPA records. Dry matter feed intake was estimated based on National Research Council predictions for each cattle category, as were methane emission calculations.
According to EPA, the top three U.S. sources of human-based activities are the energy sector — natural gas, petroleum and coal mining — which make up 40% of the total; livestock makes up 36%; and landfills make up 18%. But nature itself is the leading source of methane emissions, with wetlands suspected as a substantial contributor.
Of burps and manure
Compared with enteric methane, manure methane predictions are more complex and harder to estimate. Manure composition, type of storage facility type, manure retention time and treatment, plus environment — particularly temperature — affect methane emissions from manure.
Hristov notes that variability of animal emissions can largely be explained by feed dry-matter intake. Feed nutrient composition is also important, but less so.
“If methane emissions from livestock in this country really are twice as high as what’s estimated now — and we don't believe they are — that would put a big target on agriculture to take measures to cut these emissions,” Hristov says. “Having an accurate and spatially explicit assessment of methane emissions from livestock is critical for reconciliation of top-down and bottom-up approaches. It's the starting point in any mitigation effort.”
Source: Penn State
You May Also Like
Current Conditions for
51°F
Mostly Cloudy
Day 64º
Night 41º
Enter a zip code to see the weather conditions for a different location.


