


Subscribe to receive top agriculture news
Be informed daily with these free e-newsletters
March 23, 2018
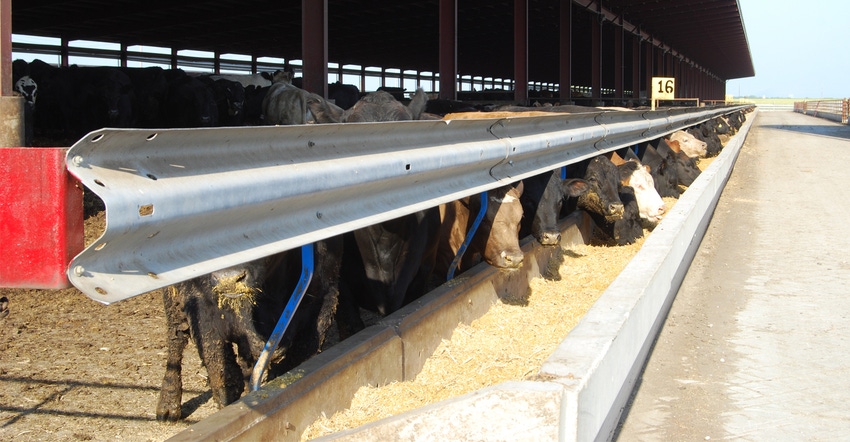
Despite a recent uptick in feedlot capacity use rate, the U.S. still has excess feedlot bunk space that’s not being used efficiently.
Over capacity became an issue in the early 2010s as cattle numbers declined cyclically and severe drought forced even more liquidation. Tightening supplies improved cow-calf profits. Cow-calf producers retaining heifers to expand herds left even more feedlot pens empty. Feedlot managers competing to buy scarce cattle to fill those pens helped push feeder cattle prices record high. That was good for cow-calf operations, not so for feedlots.
The USDA National Ag Statistics Service’s February Cattle on Feed Report provides an estimate of total capacity of U.S. feedlots with 1,000 or more head of cattle. On Jan. 1 those lots had a capacity of 17.2 million head. That’s 100,000 head under 2017’s peak but still up 1 million head from the 16.2 million first reported in 1999.
Looking at latest numbers
Analysts can calculate feedlot capacity utilization rate in several ways. One is to divide the number of cattle on feed by total capacity. Comparing Jan. 1 cattle on feed to capacity indicates a capacity use rate of 66.8% at the beginning of 2018. That’s up from 61.3% in 2017 and the highest capacity use since 2012.

Since 1999, capacity use rate, by this measure peaked in 2008 at 72%. This measure varies by the number of cattle in the U.S., whether producers are expanding or liquidating, and the timing of feedlot placements. Large feedlot placements in 2017 boosted the Jan. 1, 2018, feedlot inventory 7.2% year over year. More cattle already in feedlots on Jan. 1 partly explains the large hike in capacity use at the beginning of 2018.
Perhaps a better way to measure capacity utilization is to divide annual feedlot marketings by capacity. The available feedlot capacity is not just used once during the year but can be thought of as a flow (cattle enter and exit feedlots) with more than one turn per year.
This measure of use has steadily declined since 1999, bottoming at 1.15 in 2015 and popping back up to 1.27 through 2017. Until bottoming, this measure indicated feedlot marketings were becoming a smaller proportion of available, or potential, capacity. Several factors contributed to this decline, including fewer cattle, longer feeding times and slower turnover rates. Heavier finished weights include the effect of more days on feed.
Capacity use rate improving
The largest proportion of the adjustments to occur in the current cattle inventory cycle likely have already happened. So, capacity use rate should be stabilizing or improving. Achieving a rising capacity use rate is a big accomplishment for the cattle feeding industry. It suggests better financial health for sector.
Capacity is linked to total number of feedlots. The February Cattle on Feed Report indicated that the total number of feedlots declined from 29,219 in 2016 to 28,209 in 2017. The decrease occurred in feedlots with less than 1,000 head and 1,000 to 1,999 head.

Unprofitable market conditions in 2015 and 2016 prompted some of these sized feedlots to exit the industry or cease operations. Their physical structures still likely exist and could be reopened if economic conditions allow.
These smaller feedlots are often farmer-feeders who also raise crops. Low corn prices in 2017 encouraged them to feed more animals. Larger feedlots fed more animals, too. The over 1,000-head capacity lots marketed over 1 million head (4.9%) more cattle than the previous year, and the smaller lots upped marketings 125,000 head (4.0%) year over year. In Iowa, marketings from lots with less than a 1,000-head capacity rose 14,000 head (1.9%) and 1,000-or-more-head-capacity feedlots marketed 79,000 head (7.8%) more.
Cattle feeding profits return
As expansion boosts cattle inventories, capacity use rate should also rise if the number of feedlots has stabilized. Cattle feeders made money in 2017. Estimates put 2017 returns at the second highest since 2003 and not much lower than the phenomenal level in 2014. Steers were estimated to be sold in January and February 2018 at a $66.87 per head and $103.46 head profit, respectively. Currently, net returns projected for closeouts in March are $7.05 per head.
Could feeding profits prompt some now empty lots to again feed cattle? Can the industry feed more cattle to boost capacity use rates further and spread fixed costs over more cattle? Market conditions will answer both questions.
The result may be a changing capacity utilization rate in coming years and something for the cattle industry to keep an eye on. Wringing excess capacity out of the system takes time, and that typically happens through financial losses and industry exits.
Schulz is the Iowa State University Extension livestock economist.
You May Also Like
Enter a zip code to see the weather conditions for a different location.


