Are land prices high? Is inflation high? The answer to both questions depends on what measuring stick you use.
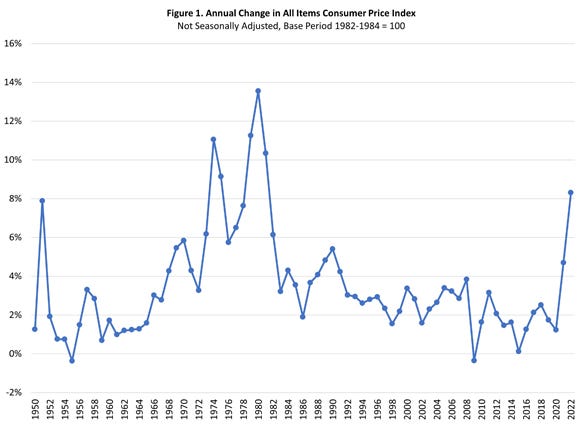
Newscasters report the 8.3% annual inflation rate in mid-2022 is the highest in 40 years. But is that high? Figure 1 shows the annual percentage change in the consumer price index since 1950. The 8.3% mid-2022 spike is indeed a 40-year high. From 1992 through 2020, the annual inflation rate ran mostly 2% to 3% per year, with a deflationary dip of −0.4% during the Great Recession in 2009.
For perspective, in 1980 the annual change in the U.S. CPI was 13.5%. The annual inflation rate climbed steadily from the mid-1960s to 1980.
The current inflation spike is concerning. Still, it has not persisted very long — yet — which may make inflation easier to rein in.

Similar land price trends
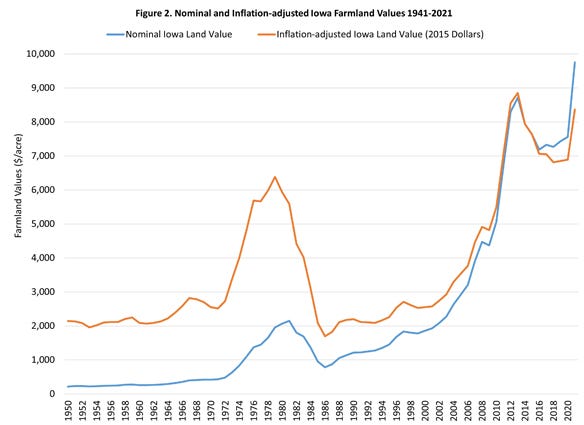
Figure 2 shows nominal average prices for all grades of Iowa farmland back to 1950, based on Iowa State University surveys. Another view is to adjust land prices to constant dollars to remove inflation. When cast in 2015 dollars, the late 1970s land price run-up into the farm financial crisis of the early 1980s is remarkably like the inflation-adjusted land price run-up into the 2009 recession.
In the mid-1960s, gradually accelerating inflation began hiking land prices. Skyrocketing commodity prices during the grain export boom to the Soviets during the early 1970s added lift.
Strong world grain demand since 2000 is boosting commodity prices and bolstering farmland prices. Recent inflation adds buoyancy to land.
Does the 2021 constant-dollar land price peak of $8,367 per acre topping the 1981 peak of $6,384 by $1,983 suggest another land price collapse is on the horizon? We do not know. However, we do know that expected commodity prices, expected yields, expected production costs, expected net crop and livestock returns per acre as they drive debt repayment capacity, and how interest rates impact debt service requirements, are factors to watch.

Futile fight against inflation
Some people trace the roots of the inflation of the 1960s back to President Lyndon Johnson trying to finance the Great Society program and the buildup to the Vietnam War at the same time. In the 1970s, President Richard Nixon implemented wage and price controls to stem inflation. President Gerald Ford offered a variety of voluntary anti-inflationary initiatives complete with “Whip Inflation Now” campaign-style buttons. Inflation kept accelerating.
Americans sensed that the United States was not serious about controlling inflation. People chose to “buy now because it will cost more later” as a hedge against inflation. Farmers bought land that was “certain” to rise in value.
For hedge-against-inflation strategies to work:
People need to formulate their expectations of future inflation.
People need to position their portfolios to profit from the expected inflation.
The inflation rate that occurs must match their expectations.
The lip-service efforts to control inflation in the 1970s reinforced Americans’ expectations that inflation would continue. Buying now as a hedge against inflation made expectations of continuing inflation self-fulfilling prophecies, making inflation harder to rein in.
In 1979, President Jimmy Carter nominated Paul Volcker to serve as chairman of the board of governors of the Federal Reserve System. In a nutshell, Volcker clamped down on the money supply growth rate to slow the rate of growth in dollars chasing goods. Tight money policy began to wring expectations of continuing or accelerating inflation out of the economy.
In the early 1980s, interest rates skyrocketed under the Fed’s tight money policy. The Fed’s current policy is to lift interest rates enough to slow inflation, without triggering a recession. Accomplishing that goal is tricky, because numerous factors that the Fed cannot control also drive inflation.
The liquidity trap
Sharply higher interest rates of the early 1980s drove cash needed to service debts sharply higher, particularly for farmers who had borrowed long-term money on variable-interest-rate loans to buy land. Easing inflation dimmed prospects that commodity prices and net farm income would rise at the rates farmers had come to expect.
Americans, including farmers, began to recognize the government was serious about controlling inflation. Farmers found their portfolios were misaligned with revised expectations of inflation. They worked to realign their portfolios. Often, that realignment came in the form of selling land. The motivation to sell land sometimes came from the lender who held the secondary security interest in that land.
Land values plunging below debt against it left farmers with no good alternatives. Too often bankruptcy loomed.
Educate your lender
Many farms are multigeneration operations. The younger generation, who did not manage through the farm financial crisis, has opportunities to learn from the older generation who did.
Institutional memory of some agricultural lenders is much shorter. Ten years ago, many young ag loan officers had no firsthand experience with the farm financial crisis. Today, even some middle managers lack that knowledge.
Farmers could be wise to help their lenders understand the tough times of the early 1980s. More importantly, farmers should line up more credit should the need arise.
Reasons for optimism
Market analysts generally believe world grain and oilseed stocks are tight enough that strong commodity prices should continue for at least a couple years.
While interest rates are up sharply from most of the last 15 years, they are still well below the peak rates of the early 1980s.
USDA’s Economic Research Service estimates the 2022 aggregate U.S. farm debt-to-asset ratio at 16.43%, which is well below the aggregate debt-to-asset ratio of 21.66% in 1981. That suggests farmers have borrowing capacity if they need to borrow to get liquidity.
Interest in buying land appears to be holding firm. That suggests farmers who want to sell land to improve liquidity and trim debt load have opportunities to do so.
In tough times only one true risk management strategy exists. That is: Have something stashed away in a sock. Building liquidity to improve financial staying power is easier to do during good times than it is when financial stress looms.
Otte, now retired, was the economics editor for Farm Progress publications for 36 years.
About the Author(s)
You May Also Like


