
Subscribe to receive top agriculture news
Be informed daily with these free e-newsletters
June 7, 2012
In addition to the Ag Risk Coverage (ARC) program in the Commodity Title, the Senate Ag Committee’s 2012 Farm Bill (summary, with more details on SCO) also includes an optional program to supplement individual insurance coverage with county-level yield or revenue coverage in the Crop Insurance Title. The Supplemental Coverage Option (SCO) offers county-level coverage for a portion of the individual farmer’s insurance deductible. For farmers who choose to enroll in the ARC program, SCO will cover losses ranging from their elected insurance coverage level to 79% of the SCO guarantee, resulting in a 21% deductible. For farms not enrolled in ARC, SCO coverage would range from their insurance coverage level to 90% of the SCO guarantee, resulting in a 10% deductible.
The SCO is a relatively complicated program for which I intend to provide a series of farmdocDaily posts. Today, I focus on the mechanics of the program and take a look at conditions under which SCO payments would be triggered using historical data for corn in McLean County, Illinois, as an example. I am also limiting discussion today to the case where the farmer is NOT enrolled in the ARC program. Future posts will compare ARC and SCO, and discuss the choice among the program alternatives.
The yields and prices used to set SCO’s guarantee and to determine losses in a given crop year are assumed to be similar to those used for the GRP and GRIP area insurance plans. One exception is that there will not be a payment multiplier for SCO (producers can elect a multiplier on GRP and GRIP of up to 150%). The current language of the Senate Ag Committee’s farm bill leaves many of these details up to the discretion of the Secretary of Agriculture and the Federal Crop Insurance Corporation as the program’s administrator.
For the example provided here, the yield guarantee is a simple linear trend yield estimate based on historical NASS yield data from 1972 to 2011. The SCO price component for this example is based on futures prices with the base or guarantee set at planting time. For yield coverage, actual yield for the county reported by NASS is compared to the trend yield with losses valued at the base price. For revenue coverage, the actual price is determined during a period around harvest. The revenue guarantee is the product of the base price and the trend yield, with losses for revenue coverage determined by comparing this guarantee to actual revenue – the product of the harvest price and actual yield for the county.
Regardless of the farmer’s insurance choice, SCO payments require a loss exceeding 10% of the guarantee to trigger a payment (alternatively, actual yield/revenue must fall below 90% of the guarantee). The maximum SCO payment that may be received is determined by the farmer’s insurance coverage. For example, for a farmer with 80% revenue protection, SCO payments would reach their maximum if actual county revenues fell below 80% of the SCO revenue guarantee. SCO is outlined as an insurance product with the premium subsidized at a flat rate of 70%.
Scenarios are compared where the farmer purchases yield or revenue protection with the harvest price exclusion (YPwHPE or RPwHPE) at a coverage level of 80%. Different insurance program and coverage level choices would result in different SCO payments over time.
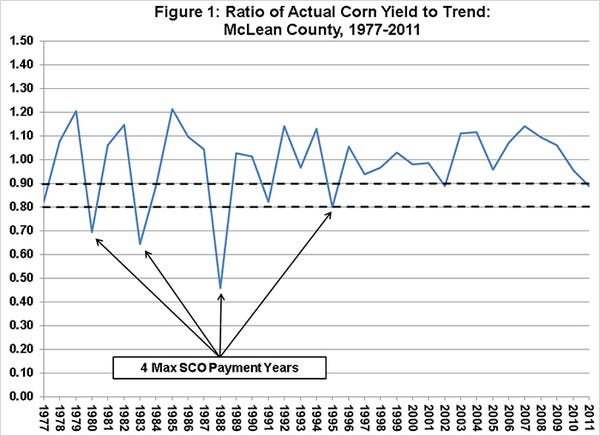
Figure 1 reports the deviation from simple linear trend yield in McLean County from 1977 to 2011. Yields fell below 90% of trend in nine out of the 35 crop years, indicating SCO with 80% yield insurance would have triggered payments in those years. Maximum SCO payments would have been triggered in four of those payment years – 1980, 1983, 1988 and 1995 – as actual revenues fell below 80% of the guarantee.

Figure 2 reports the deviation from the SCO revenue guarantee (base price x trend yield) for McLean County from 1977 to 2011. SCO payments would have been triggered in 17 of the 35 years, with the maximum payment triggered in six of those years – 1977, 1983, 1988, 1991, 1998 and 2000.
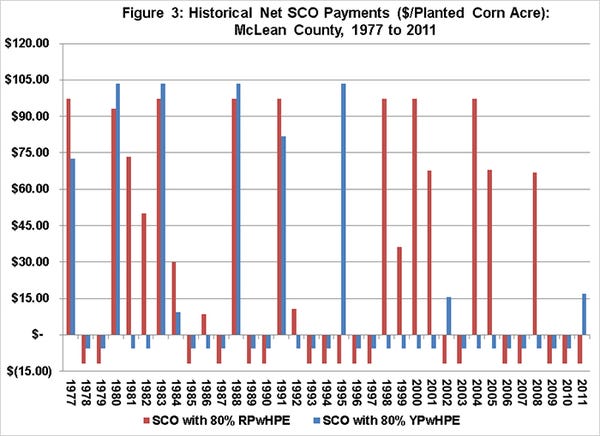
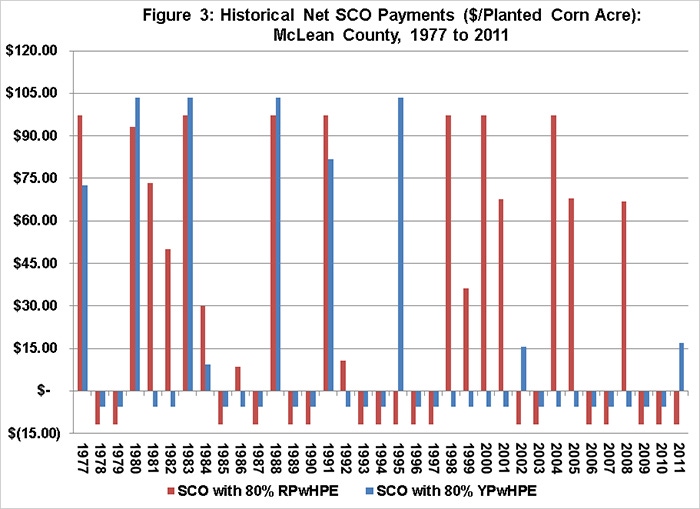
Figure 3 provides a historical comparison of net payments for SCO with 80% yield (blue bars) and revenue (red bars) insurance. The net payment was defined as the SCO payment less the farmer’s portion of the premium. The fair premium was set equal to the average payment level across the 36 years considered ($19/acre for SCO with 80% yield insurance, $40/acre for SCO with 80% revenue insurance), and farmer paid premiums were set to 30% of the fair rate ($6/acre for SCO with 80% yield insurance, $12/acre for SCO with 80% revenue insurance).
Large payments for both supplemental options would have been triggered in the 1980, 1983, 1988 and 1991 crop years. There are also years where SCO with yield insurance would have triggered payments, but SCO with revenue insurance would not have triggered payments – 2002, 2011, and a very large SCO with yield insurance payment in 1995. In these years, insurance price increases during the crop year offset the realized yield losses. SCO with revenue insurance would have triggered payments in years when losses were driven by within-year price declines, notably in the early 1980s, late 1990s and early 2000s. Note also the years when SCO payments are not triggered and the farmer would have to give up the subsidized SCO premium.
The average net payment in the McLean County example was just under $28/acre for SCO with 80% revenue insurance and just over $13/acre for SCO with 80% yield coverage. While there is some slight variation across counties in Illinois, expected payment estimates are similar in other areas of the state. In both cases, these expected net payments are larger than those calculated for the county- and farm-level ARC program using similar methods. Therefore, SCO might be an attractive option for some farmers and, depending on adoption rates and price and yield realizations over the next farm bill period, an expensive program to administer.
The choice between ARC and SCO (as well as the option to combine them) and the impact of their availability on crop insurance choices are issues that should carefully be considered. The yield protection offered by the SCO program is arguably better than ARC as it is assumed to incorporate yield trends. However, the price component of SCO, which is assumed to be similar to insurance programs, does not offer the multi-year price protection provided by ARC’s moving average. Adoption of SCO among farmers may also be impacted by the way in which it will be administered – through the Federal Crop Insurance Corporation. In contrast to ARC, which would be administered through the Farm Service Agency, there will be direct financial incentives to the crop insurance industry to support and encourage enrollment in SCO.
You May Also Like
Enter a zip code to see the weather conditions for a different location.


