
Subscribe to receive top agriculture news
Be informed daily with these free e-newsletters
March 19, 2013
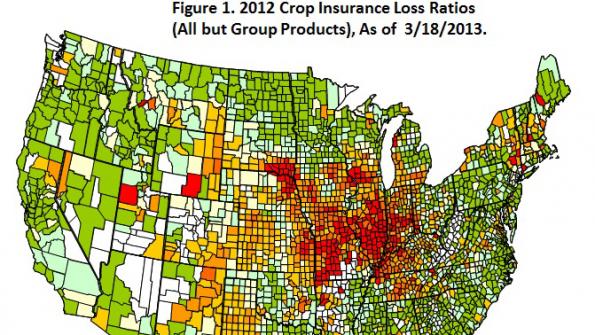
Yield losses from the 2012 drought caused large crop insurance payments. In this post, 2012 loss ratios are shown for U.S. counties, thereby allowing areas of high loss experience to be identified. Higher loss ratios occurred in eastern Kansas, Missouri, central and southern Illinois, western Indiana, and western Kentucky. This area corresponds to the area where corn yield losses were most pronounced (see Locating the 2012 Drought Using State Corn Yields and Projected 2012 Crop Reporting District Yields Relative to Trend-line Yields). The areas of high losses in 2012 bear little relationship to typical losses across the United States.
Loss Ratios in 2012
Figure 1 shows 2012 county loss ratios calculated using Summary of Business data available through the Risk Management Agency's website. Data were included for all products except the Group products (Group Risk Plan and Group Risk Income Plan), as payments for these Group products have not been reported in the Summary of Business. Inclusion of data from Group products likely will not influence loss ratios significantly. Data were downloaded on March 18, 2013. Not all payments have been included in the Summary of Business; hence, loss ratios shown in 2013 could increase as more of the premiums are processed. However, loss ratios shown in Figure 1 likely are close to final and generally represent the loss experience across the United States.
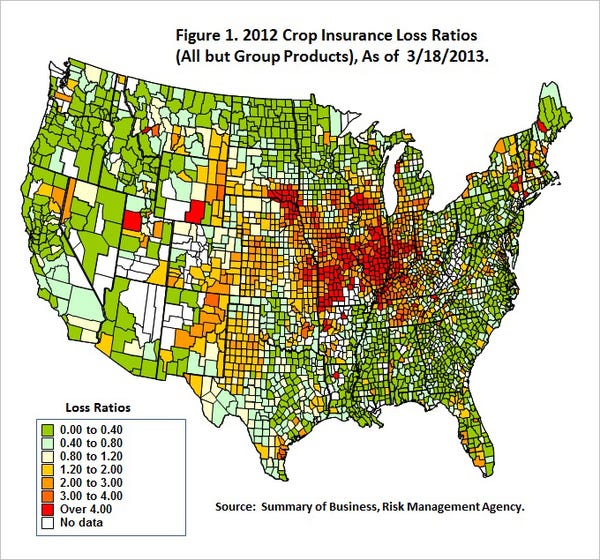
A loss ratio equals insurance payments divided by total premium. A ratio less than 1 indicates that payments are less than premium, with lower loss ratios indicate fewer claims. Generally, counties with loss ratios less than 0.40 – darker green counties in Figure 1 – had few claims. A loss ratio greater than 1 indicates payments are greater than total premium. In 2012, higher loss ratios generally reflected poorer yields. Loss ratios above 3.00 – dark orange and red in Figure 1 – had much larger payments than total premium. Many of these areas had low corn yields in 2012.
Like what you're reading? Subscribe to CSD Extra and get the latest news right to your inbox!
As can be seen, many counties in eastern Kansas, Missouri, central and southern Illinois, western Indiana and western Kentucky had loss ratios above 4.0. Hot, dry weather during the summer caused these areas to have large yield losses. This appears to be the center of the drought impacting the Midwest. Other areas that had loss ratios above 4.00 include:
An area centered around northeast Nebraska and southeast South Dakota
Parts of southern and southwest Iowa
Parts of southern Wisconsin, northwest Illinois, and east-central Iowa
There also were areas that had less severe losses, as judged by loss ratios between 1.20 and 4.00. These areas include western Texas, southern Kansas, eastern Colorado, western Nebraska and eastern Wyoming and Montana.
There were areas were loss ratios were low. Minnesota, North Dakota and northern South Dakota had loss ratios that were below 0.4, indicating low loss experience. In addition, many southern states had low loss ratios.
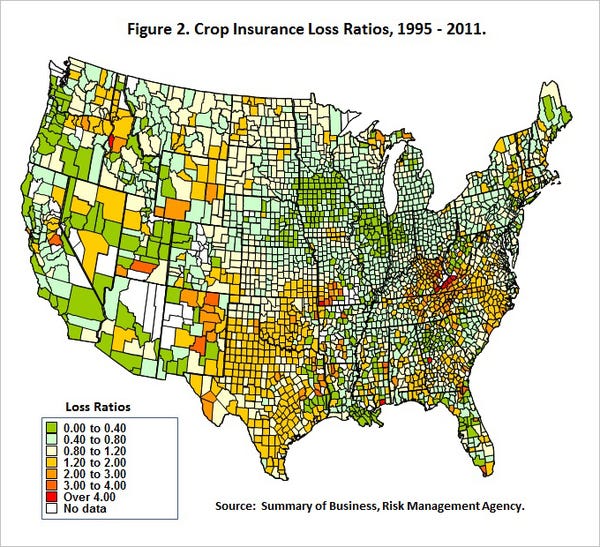
The 2012 loss ratio experience differed from typical loss ratio experiences. Loss ratios from 1995 through 2011 are shown in Figure 2. As can be seen in Figure 2, much of Illinois and Iowa had loss ratio below 0.8, with a significant number of counties having loss ratios below 0.4. These areas, particularly Illinois, had large losses in 2012. In addition, some areas typically have higher losses that did not have large losses in 2012. These areas include the North Dakota and the southern states.
Summary
In terms of loss experience, the 2012 drought was most severe in eastern Kansas, Missouri, southern and central Illinois, western Indiana, and southern Kentucky. The loss ratios in these areas were high in 2012, untypical for these regions. Other regions had low loss ratios in 2012 while those areas have typically higher loss ratios.
Read the article at farmdocDaily.
You might also like:
Strip-Till Systems Provide Key Benefits for Corn
Factor Field History, Weather into Crop Disease Management Decisions
You May Also Like
Enter a zip code to see the weather conditions for a different location.


