
Subscribe to receive top agriculture news
Be informed daily with these free e-newsletters
April 19, 2013
This post is the third in a series that contrasts and compares the farm prosperity of the 1970s with the current period of farm prosperity. This post examines U.S. farm debt during the two periods. The previous posts are available here andhere.
Analysis
This article uses 5 variables:
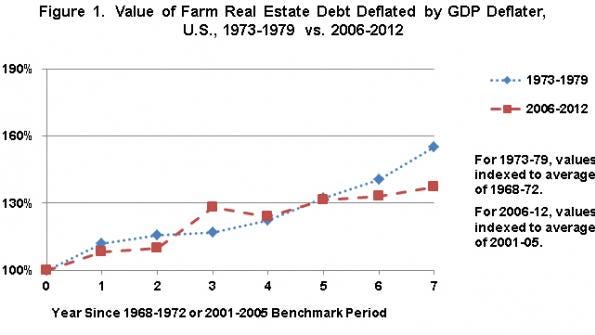
U.S. farm real estate debt on December 31 - includes both land and buildings
U.S. farm non-real estate debt on December 31
Financial assets of U.S. farms on December 31
U.S. cash farm production expenses for the calendar year - includes farm origin and manufactured inputs, as well as interest, labor, property taxes, and land rent
The U.S. Gross Domestic Product (GDP) price deflator. Economists commonly use the GDP price deflator as a broad measure of price inflation in a nation's economy. The GDP deflator is obtained from the Federal Reserve Bank of St. Louis. Rest of the data is from the U.S. Department of Agriculture (USDA), Economic Research Service.
To facilitate comparison of the two periods, measures are indexed, also called benchmarked, to a five-year period that predates the start of the period of prosperity. The benchmark periods are 1968-1972 for the 1970 period of farm prosperity and 2001-2005 for the current period of farm prosperity. Five-year benchmark periods are used to dampen the variability that can exist if a single year is used as a benchmark.
The latest calendar year for which information is available for all variables is 2012, the seventh year after 2005. As a result, the 1970 period ends with 1979, the 7th year after 1972. There is no definitive way to decide when to start the period of prosperity or what period to use as a benchmark, but these choices are reasonable. As more data becomes available for the current period, the analysis period can be extended, but seven years is a long enough period for an initial comparative examination.
Summary Observations
Consistent with the previous posts in this series, this post finds that the current period of farm prosperity is not the same as the 1970 period of farm prosperity, even though similarities exist. The behavior of farm debt is a clear and distinct difference, especially in regard to non-real estate debt.
A common interpretation is that farms learned a lesson in the 1970s about the danger of acquiring too much debt. However, an alternative interpretation is that, up to this point in the current period of farm prosperity, farms have been spared the hard decision that arose during the 1970s: whether to borrow debt that extended across calendar years to put out the crop. They have been spared this hard decision, at least in part, because cash production expenses have increased about 20% less than during the 1970s and because deflated net cash farm income has continued to increase through 2012 unlike during the 1970s when it declined after an initial spike upward. These observations imply that the real test of the current period of farm prosperity has yet to occur.
Because the two periods of farm prosperity have striking differences in the behavior of farms toward debt and financial assets, it is not clear that farms will respond the same way to a decline in net cash farm income. It is possible that farms will respond to lower net cash farm income by aggressively lowering farm rents, reducing substantively their bids for farm land, and by reducing the use of farm inputs. In other words, land ownership and input suppliers may end up bearing more of the risk of farm adjustment earlier in the adjustment period if cash farm income declines. In the next post in this series, we will examine why cash production expenses have gone up less in the current period of farm prosperity.
This publication is also available at http://aede.osu.edu/publications.
You May Also Like
Enter a zip code to see the weather conditions for a different location.


