Subscribe to receive top agriculture news
Be informed daily with these free e-newsletters

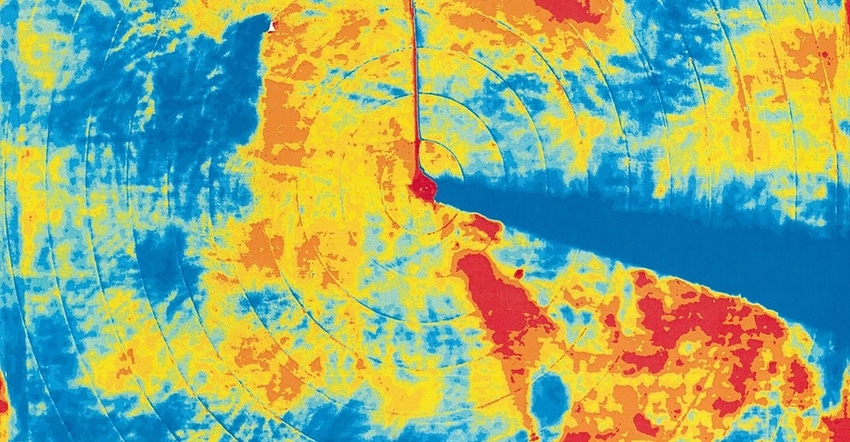
Crop canopy temperature can indicate water stress and crop water demand to give a more complete picture of the water balance.
What can crop canopy temperature tell you? If you're an irrigator, quite a bit.
Since 2012, Kendall DeJonge, an ag engineer with USDA's Agricultural Research Service, and other researchers at the Water Management and Systems Research Unit in Colorado have been using a kind of infrared temperature sensor on corn canopies.
Called an infrared thermal radiometer, the IRT compares water use by corn under deficit irrigation and full irrigation. DeJonge is carrying on the research started by his predecessor, Walter Bausch, around 10 years ago.
The goal, DeJonge says, is to quantify evapotranspiration (ET) under limited irrigation and find strategies to optimize production in situations where less water is available. "We're comparing full irrigation where we give it all the water to limited irrigation," he says. "We're trying to quantify how much water the crop uses if we intentionally stress it."
Accounting for spatial variability
DeJonge notes an ongoing challenge is measuring spatial and temporal variability simultaneously. For example, if a center pivot crosses part of a field and the canopy temperature suddenly drops, it's difficult to account for that change in that part of the field at that point in time.
So, in addition to IRT measurements to provide canopy temperature information from the ground, DeJonge and Huihui Zhang, physical scientist at the Water Management and Systems Research Unit, are using an unmanned aerial vehicle equipped with a FLIR Tau 2 thermal camera to spatially measure crop canopy temperatures across the field.
"IRT is a point measurement, so where you set your IRT in the field, it's one measurement. You need to adjust the IRT angles to see the canopy," Zhang says. "But with a UAV, you're mapping an entire field — the entire area you want to fly. It's giving you a spatial map rather than a spatial point."
They're also using a neutron probe, as well as a time-domain reflectometry (TDR) sensor, to collect soil moisture data weekly to determine how much water is being used by the crop and lost to deep percolation and runoff, to get a more complete picture of the water balance.
"The idea is the more canopy you have, the more water it's going to use. If you have a small crop and you're not covering a lot of the ground yet, you're not using much water," DeJonge says. "If your crop is under stress, you're actually going to be using less water. If your crop is under stress, you get leaves starting to wilt up, and they actually get warmer because they're transpiring less."
New way to calculate crop water use
While fully irrigated fields tend to have more stable canopy temperatures throughout the day, deficit-irrigated fields fluctuate more. The difference between those two is what DeJonge calls "Degrees Above Non-stressed," or the DANS index.
As part of his research, DeJonge is comparing different indices like the Crop Water Stress Index (CWSI) and DANS. These stress indices are plugged into equations — along with coefficients for canopy cover and reference ET — to calculate crop water use for irrigation scheduling decisions.
Comparing these indices, DeJonge hopes to determine the best options for deficit irrigation strategies or situations where, either due to low-capacity wells or allocations, irrigators don't have as much water to work with, and need to get the most production out of the water available.
"If you're fully irrigating your crop, it's probably not going to be that useful, because you're not going to be under stress," DeJonge says. "But if you have spatial variability in your field, especially in soils, if you have sandier portions that are going to run out of water sooner, knowing they are going to get warm is something that could be valuable."
While the CWSI is considered the gold standard for irrigation scheduling, DeJonge believes there may be a simpler solution. The DANS index, for example, requires two measurements for canopy temperature — one for the stressed crop and one for a reference crop that hasn't been stressed — and use the difference between the two to determine the stress coefficient. CWSI requires additional inputs like ambient air temperature and humidity to determine stress, which can be difficult to measure spatially across a field.
The benefit of crop canopy temperature, he says, is it already accounts for these stress factors, as well as soil moisture, integrating them into a single value. What's nice about canopy temperature is it already does that for you. That crop tells you whether it's happy or not very simply," DeJonge says. "The plant becomes its own sensor."
You May Also Like
Enter a zip code to see the weather conditions for a different location.


