November 21, 2019

Key performance metrics for swine production include feed conversion, litters per sow per year and pigs per litter. All these have improved dramatically over time in the U.S. Improvements in production performance are critical to controlling production costs. This helps the industry remain competitive with swine producers in other countries and with competing meats. Let’s look closer at long-term trends in pigs per litter in the U.S.
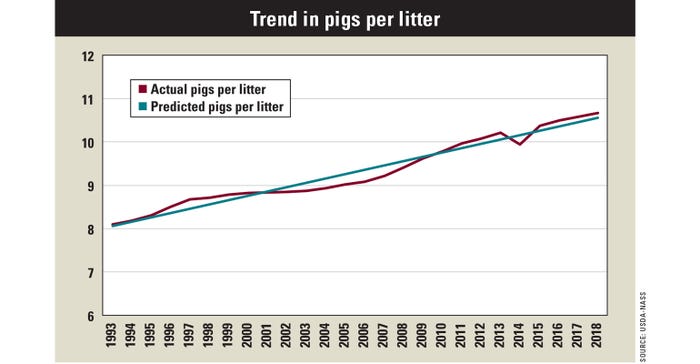
Pigs per litter data is available from USDA’s National Agricultural Statistics Service on a monthly, quarterly and annual basis. The graph below illustrates actual and predicted pigs per litter from 1993 to 2018. A simple linear trend was used to predict pigs per litter for each year.
The annual growth rate in pigs per litter was 0.1 pig per year, or 1.07%. This may seem small. However, over the 26-year period, this equates to 2.57 pigs, or an increase of about 32%.

Production performance, measured using pigs per litter, has been particularly strong in the past few months. For the first and second quarters of 2019, pigs per litter averaged 10.75 and 11.05, respectively. In August, the latest month for which data is available, pigs per litter was 11.2.
In contrast, the predicted number of pigs per litter for 2019 was only 10.66. If pigs per litter for the remaining months in 2019 averaged 11, that would make 2019 one of the best years in terms of improvements in production performance over the past three decades.
Improvements in production performance, such as litters per sow per year and pigs per litter, have impacts on the number of sows needed to supply domestic and export markets. Obviously, if pigs per litter had not increased, we would need a much larger sow herd.
In addition to production performance, the increasing market weight of barrows and gilts has impacted the size of the sow herd needed to supply our markets.
Production performance
To provide some perspective on the importance of production performance and market weights, let’s contrast the growth rates in sows farrowed, pig crop and swine production in pounds. The annual growth rate in the U.S. sow herd during the 1993-to-2018 period is less than 0.01%. In contrast, the annual growth rate in the U.S. pig crop and U.S. swine production are 1.13% and 1.87%, respectively.
Recall that pigs per litter has increased at a rate of 0.1 per year, or 1.07%, since 1993. Continued improvements in production performance will help ensure the U.S. swine industry remains competitive.
Langemeier is a Purdue University Extension agricultural economist and associate director of Purdue’s Center for Commercial Agriculture. He writes from West Lafayette, Ind.
About the Author(s)
You May Also Like


