Subscribe to receive top agriculture news
Be informed daily with these free e-newsletters

Check out Iowa State University data on how practices impact nitrate flows.
June 30, 2017
The recommendations Iowa State University makes on water quality practices for Iowa’s Nutrient Reduction Strategy are based on monitoring and research going back as far as the 1970’s that continues to this day. It’s expensive, but essential in verifying practice performance and informing both farmers and the public.
-------
In a series of half-day programs at five ISU water quality sites the last week of June, called Nitrogen and Water Week, Extension specialists explained what’s involved in setting up research and water quality monitoring programs, then followed up with research results.

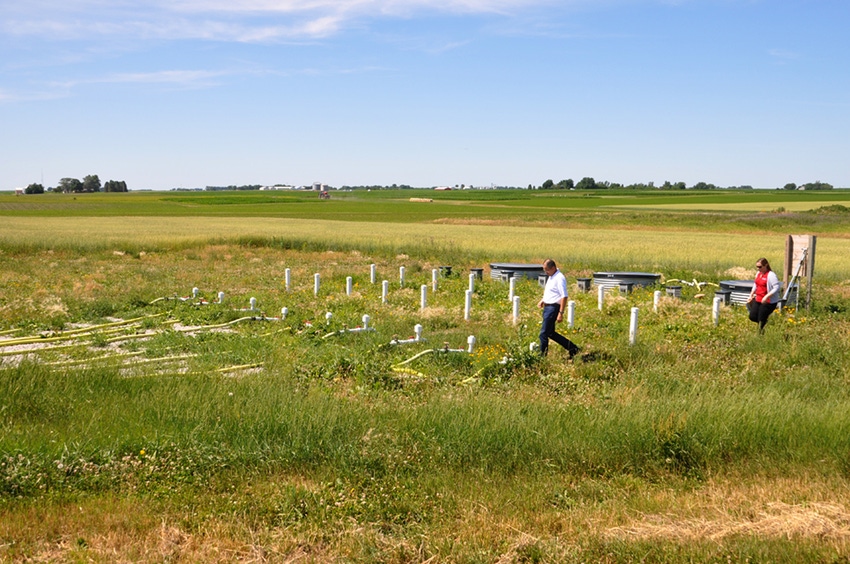
At the ISU nitrogen and water week workshop near Boone, Iowa, farmers and ag business reps viewed ISU water quality research equipment, including the first site to ever be monitored for water quality in the 1970s.
“We have 172 plots in all, and take about 4,000 water samples a year from them,” ISU Agricultural Engineering Specialist Dr. Matt Helmers told a group of farmers and agribusiness reps at the ISU Ag Engineering and Agronomy Research Farm near Boone. He said ISU has more than a $500,000 investment in drainage water quality monitoring infrastructure and monitoring equipment, the first of which was installed more than 40 years ago.
“Our goal is to help farmers manage nitrogen and other nutrients for improved profitability and improved water quality,” said Jamie Benning, ISU Water Quality Program Manager. That includes helping meet Iowa’s Nutrient Reduction Strategy goal of a 41 percent reduction in nitrogen and phosphorus loading in streams and rivers.

Mark Johnson reviewed research results on water quality monitoring plots, encouraging farmers to use research to play the odds on nitrogen rates. He said using yield goals to plan N application rates is no more than a wild guess.
ISU monitors the concentration of nitrate-nitrogen, or nitrate N, in tile drainage water, measured in milligrams per liter, explained Dr. Kapil Arora. Researchers also measure total nitrogen load, or nitrogen loss exiting tile drainage lines, in pounds per acre, as well as the volume of water leaving tile, in cubic feet.
In-line flow meters, area velocity meters, passive sampling, and sump pumps are all part of the monitoring equipment being used. The equipment is not inexpensive—setup cost for 32 plots of pumped monitoring recently was $150,000, the area velocity meters used in some cases are about $2,500 per sensor, and auto samplers are about $3,500 each. But the equipment is essential to verify and inform both farmers and consumers how well water quality practices are working.

The quick check of one bioreactor with N test strips showed nitrate levels in tile above a bioreactor at 15 mg/L, and nitrate-N levels after bioreactor treatment at 7 mg/L.
The research has been key to choosing which practices are most effective economically and environmentally. “There’s a lot of emphasis on how much nitrogen to apply, when to apply it, which form to use, and that kind of thing,” said ISU field agronomist Mark Johnson. “But those in-field N management practices don’t give big numbers in reduction of nitrates leaving the farm. Rates, timing and source of N provide only 4 to 10% reduction of nitrate-N in water for the most part. The big numbers come with cover crops, living mulches and edge of field practices like wetlands, drainage water management, bioreactors and saturated buffers.”
Johnson said a 10% reduction of nitrates in water could come about if the farmers who over-apply would use ISU’s corn nitrogen rate calculator to reduce rates to maximum return to N rates (MRTN), and not base N rates on expected yield. He also said use of nitrapyrin (Instinct, N-Serve) in the spring shows no yield or water quality benefit. Rye cover crops have the biggest impact in reducing in-field nitrate-N loss to water, he said. “My biggest disappointment is the low adoption rate for cover crops,” Johnson said. He also noted the huge benefits that can come from putting 10% of a field into prairie strips.
ISU has focused research on the effects of nitrogen management on crop production and tile drainage water quality near Gilmore City in north-central Iowa since 1989. Takeaways offered by ISU from that research include:
· When N-fertilizer is applied at economic N-rates, the average concentration of nitrate-N in tile drainage ranged from 12 to 16 mg/L, slightly above the drinking water standard of 10 mg/L).

Rye cover crops reduced nitrate-N concentrations in both corn and soybeans by more than a third.
· When similar N-application rates to corn are used in 1) a corn-soybean rotation and 2) a continuous corn rotation, similar nitrate-N concentrations are observed in the tile drainage. When an additional 50 lbs N/acre are applied to continuous corn, however, nitrate-N concentrations are about 25 percent greater than the corn-soybean system.
· A fertilization rate of 120-160 lb-N/acre for a corn-soybean rotation allowed the corn to reach its yield potential.
· Over the long-term, approximately 10 inches of the annual 30 inches of precipitation exited through tile drains. This resulted in an average nitrate-N loss of about 36 lb/acre through the drainage system with a 150-160 lb/acre N-fertilization rate to corn in a corn-soybean rotation. Due to weather conditions, the annual N-loss varied from 0.9 lb/acre to 94 lb/acre.

A consistent 150-160 lb N/acre fertilization rate at Gilmore City produced a wide variation in nitrate-N concentrations over 26 years (blue line) because of weather conditions, including a spike in 2013 after N remained in the soil from a dry 2012.
· In a corn–soybean rotation with no N fertilizer applied, there was still a 15-20 lb N/acre loss through tile drains at nitrate-N concentrations of 6-8 mg/L.
· In general, concentration of nitrate in the tile drainage was similar for the corn and soybean phases of the corn-soybean rotation.
· The nitrate concentration in tile drainage from treatments fertilized with liquid swine manure was similar to those treated with equal amounts of commercial fertilizer. Generally, yields were improved using swine manure.
· During the nine years that timing of fertilizer application was studied, there was little difference in the concentration or loss of nitrate between spring- and fall-applied N fertilizers.
· Use of a cover crop has the potential to reduce nitrate-N concentration in drainage water.
· Perennial land use (orchard grass and clover mix) has the potential to dramatically reduce nitrate-N concentrations in drainage water.
· Overall, long-term research has shown that nitrate-N concentrations generally exceeded 10 mg/L under a corn–soybean rotation when fertilized at common rates; even when no fertilizer is applied, there is loss of nitrate. Based on these studies, high nitrate-N levels are less about mismanagement of N-fertilizer and more a result of the land use and cropping practices.

Cover crops (green line) cut nitrate-N concentrations in continuous corn, but planting prairie dramatically cut N concentrations, whether fertilized or not. ISU says that indicates the potential of prairie strips as a nitrate removal practice.
You May Also Like
Enter a zip code to see the weather conditions for a different location.


