

Subscribe to receive top agriculture news
Be informed daily with these free e-newsletters

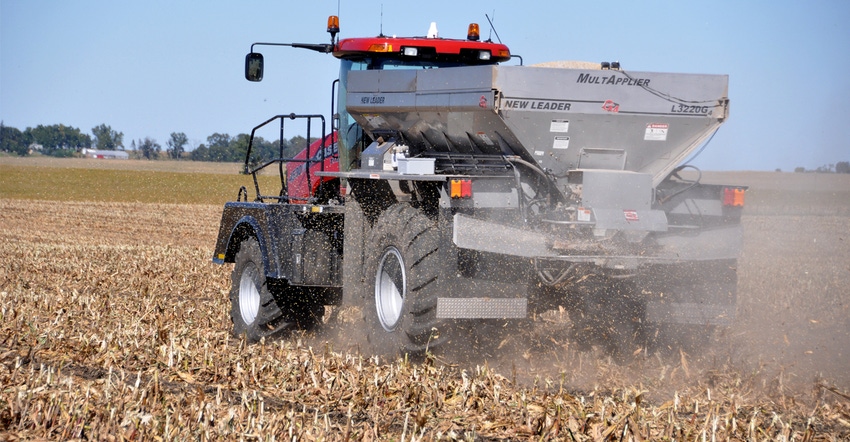
Soybean Source: Can you count on some carryover P and K for 2018? How much?
September 22, 2017
Yield variability across crop reporting districts, between different fields and within fields is a given every year across Iowa. All indications are that the 2017 crop year might bring as much or more yield variability than any year in recent memory.
After a soggy start to the planting season, a tough summer left 10 counties as primary disaster areas and an additional 16 eligible for natural disaster assistance due to drought. With other areas of the state suffering significant storm damage, there are a lot of rough-looking fields, so we are likely to see yield maps with colors that won’t paint a pretty picture.
Coupling lower yields with crop prices that are in the tank, a common question is: “Can we count on some carryover P and K for 2018 in lower-yielding areas?” The short answer is yes, but as usual in agronomy, there is more to the story.
With variable and generally lower yields across areas of the state, we can expect there would be “carryover” fertilizer nutrients from soil reserves and past applications. The wide range of yield levels within many fields complicates things, though.
Focus on soil tests
A prime example is an early-harvested cornfield in southwest Iowa that was running 150 to 180 bushels of corn per acre on the better ground on one end of the farm, and then down into the 60s, or lower, in areas on the other end. The fertility removed by the corn in the best-yielding areas would be from 48 to 58 pounds of phosphorus and 33 to 40 pounds of potassium, while the poor area removal would be around 20 pounds of P and 13 pounds of K per acre. We can account for the removal variability with yield maps, but these rarely line up with soil fertility maps.
In the face of all this inconsistency, the place to start is your soil tests. Iowa State University recommends soil sampling every two to four years, or once in a crop rotation. In today’s economic climate, many of us are prone to sample every two years. If you are due for updated samples, we recommend trying to sample about the same time of year each.
There are many soil sampling strategies available, from management zones and grids to points or other configurations that give a true picture of the fertility variation within a field. Work with your local fertilizer retailer to set up a sampling system that fits your needs.
What do your soil test results mean?
When you get your soil test results back from the lab, sit down with your fertilizer dealer and compare them to tables found in our ISU Extension publication, “A General Guide for Crop Nutrient and Limestone Recommendations in Iowa,” PM-1688.
If your results fall into “high” or “very high” categories, no additional fertilizer is needed. However, applying fertilizer in a band may be helpful if drainage is poor, or if there’s a lot of crop residue on the soil surface.
If your results come back from the lab as “low” or “very low,” fertilizer application will be economically beneficial. With today’s crop budgets and razor-thin margins for error, the production penalties for not putting on needed fertilizer can be huge.
If the soil test category comes back as “optimum,” whether or not to apply fertilizer can become a lengthy discussion.
What if soils ‘optimum’ for P, K?
According to ISU research, there’s a 25% chance of getting a yield response from adding P and K fertilizer when soil tests “optimum” for these nutrients. ISU researchers agree maintaining soil test levels in the optimum category by fertilizing at the crop removal rate for P and K is most profitable.
On the flip side, in an individual year for an individual field, research shows there’s a 75% chance no yield would be lost from not applying fertilizer.
For soils testing optimum, if there’s a positive yield response to fertilization, it generally doesn’t take the full application rate to achieve it. So it would also be possible to apply a partial rate with a minimal chance of yield loss. But remember: Soil test levels will slowly decline if we go this route. Keep in mind that as yields increase, so does fertilizer removal, and the impact on soil test levels.
If dry conditions continue into the fall soil sampling season, the soil test results for P, K and pH also may be affected. Continued dry conditions could complicate test interpretations and may even impact them if and when we take fall samples. This is worthy of much more discussion; and ISU soil fertility experts Antonio Mallarino and John Sawyer are on point with an article on the Integrated Crop Management website. I highly recommend reading it prior to taking soil samples this fall.
Weigh various application strategies
The bottom line is that in the many areas this year yields are well below normal and P and K use by the crop was correspondingly lower. Any unused P and K is still there in the field and is building your soil test levels over time. Dialing in on where the leftover fertilizer is in the field, and where you need more or less for future crops requires some pretty advanced geometry in fields with high levels of yield variability.
The good news is that today’s advanced GPS, yield data and variable-rate technology can help deal with all these factors. Working closely with your fertilizer dealer can help you sort out the best application strategy for the 2018 crop.
In fields where yields were more consistent, the carryover can be more directly accounted for in your next P and K application. Crop removal rates for corn, soybeans, silage and stover can all be found in PM-1688. Doing some basic math will give you a picture of what was removed in 2017 and what is left for 2018.
Another wildcard in looking at soil fertility for 2018 and beyond is fertilizer costs. In watching global and domestic fertilizer markets over the years, it is hard to remember the last time we had this level of stability at relatively favorable costs. In terms of global P and K trends, it is hard to imagine there is much room for further market price softening.
While many fertilizer market experts are predicting stable to slight strengthening of P and K prices for the near future, it is hard to forget the sticker shock of the skyrocketing prices we saw a decade ago. It doesn’t take much to shake up global fertilizer markets and send them rising quickly, and domestic markets can be even more dynamic. You can see where I’m going with this; if you own or have a good tenure on farms that are short on P or K, fertilizer pricing is favorable right now; for how long is anyone’s guess.
Taking advantage of favorable fertilizer prices at a time when farm incomes are being hammered is tough to do, and may not be possible for some operations. For those that might be able to make it work, it would be something to consider if low fertility levels may be a yield-limiting risk factor.
McGrath is the On-Farm Research and Extension coordinator for the Iowa Soybean Research Center at ISU. Contact him at [email protected].
You May Also Like
Enter a zip code to see the weather conditions for a different location.


