Soybeans were the farm product hardest hit by trade troubles over the past two years. So, it’s hardly surprising that soybean-rich counties received the most money from the first round of Market Facilitation Program payments.
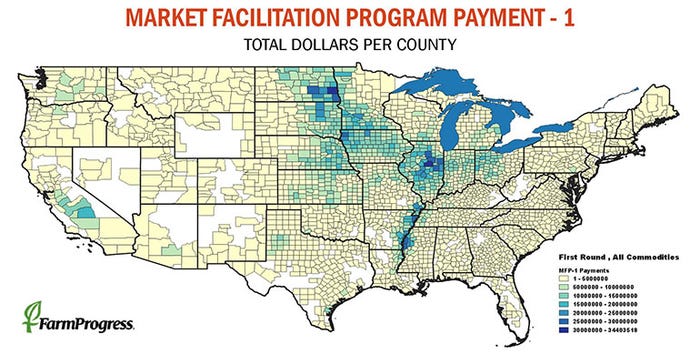
Counties in Illinois, the Dakotas and the Delta topped the list of payments as distribution of MFP-1 for 2018 crops wraps up.
Fargo County, ND, received the most of any county through July 31, some $34.4 million. Soybeans accounted for nearly 97% of that total. Soybeans were the most popular crop for U.S. farmers last year, if not in terms of price, at least in acreage. And they received the highest payment rate, $1.65 per bushel.
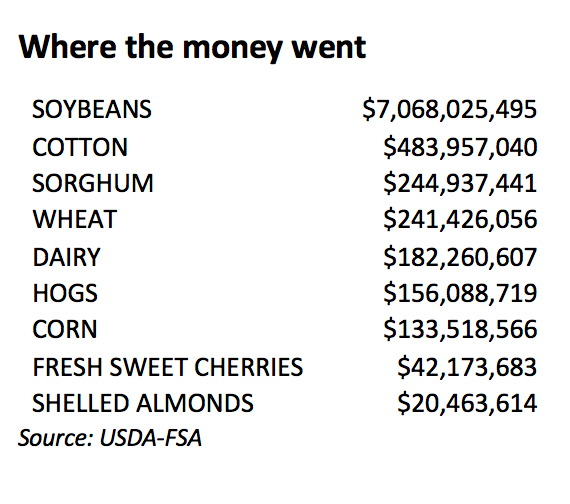
Total payments for soybeans through the end of July were more than $7 billion of the $8.6 billion paid out according to Farm Service Agency data analyzed by Farm Futures, which obtained the county breakouts after filing a Freedom of Information request.
Illinois accounted for five of the next six counties, with Normal number two, taking in $33.7 million. Champaign, Pontiac, Watseka and Ottawa also made the top 10 from Illinois, with Jamestown and Wahpeton, North Dakota making that cut as well. Two Mississippi counties, Cleveland and Greenville, rounded out the top 10.
Soybeans weren’t the only factor for other top counties getting assistance. Cotton and livestock, particularly hogs, were important too. Orange County, IA, finished No. 11, with producers there receiving $5.5 million from hog losses and another $560,000 in dairy, in addition to crop payments.
Big cotton counties included Osceola, AR, No. 12 on the list, which received $5.3 million in payments from losses due to tariffs affecting prices for the fiber.
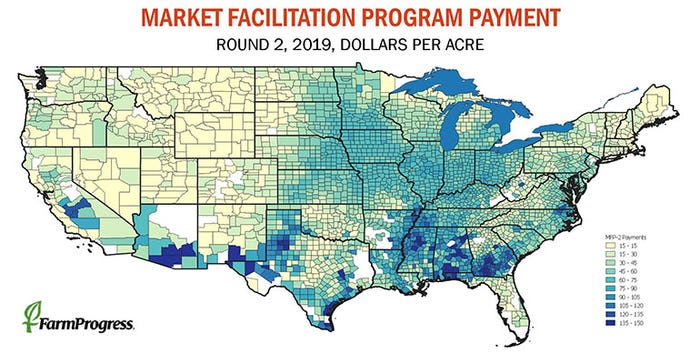
The first round of MFP for 2018 was criticized by commodity groups that received lower payment rates, notably corn, which paid only a penny a bushel. The second round of payments announced in July uses a different scheme. Total losses suffered by each county due to tariffs was estimated, and the number of commodities that were covered expanded. All acres planted to a qualifying crop will receive the same payment per acre, which was done to avoid distorting farm planting choices.
It’s still too early to know where payments from the second round of MFP will flow. Counties in the Delta again were at the top of payments per acre, with some receiving the maximum of $150. Average county payment rates in Iowa, Illinois and Indiana are $68.
In addition to maps showing where the funds are flowing, we’ve put together interactive maps that let you zero in on a particular county. Click the flag on the MFP-1 map for a county to see the individual totals for each crop or livestock category. The MFP-2 map show the rate per acre for the county.


Read more about:
DataAbout the Author(s)
You May Also Like


