January 19, 2021

Developing plans for your farming and ranching operation is a critical process. An key part of planning for a new year includes analyzing the past year and determining which crops and livestock enterprises were profitable and which were not. Part of the annual analysis can include benchmarking crop and livestock enterprises against yourself and others.
Some farmers and ranchers may see little value in benchmarking, even though everyone benchmarks their operation, maybe without realizing it. Benchmarking against yourself lets you compare changes year to year on your own operation.
Benchmarking yields from one year to the next is a good exercise. Determine what internal and external factors caused crop yields to be higher or lower than last year. Was it weather-related, good or poor seed selection, accurate or inaccurate fertilizer application, or some other factor?
You can benchmark enterprises on a field level, too. Not all farmland is created equal. It can be useful to benchmark net returns per field to determine if inputs should be varied across fields to earn the same return. For livestock producers, benchmark pregnancy percentages, live births, weaning weights or production (milk, wool, etc.). Keeping accurate records gives you the necessary data to look at changes from one year to the next.
Benchmarking against others lets you analyze your operation to determine if you are over- or under-utilizing inputs. It is useful to compare input costs by enterprise. For example, look at yields and input use by crop to see if you’re spending more for the same yield than average producers.
A valuable resource is data from the North Dakota Farm Management Educa-tion Program. Average production and financial data are compiled from farmers enrolled in the farm management programs across North Dakota. View the annual reports and compare your farm’s financial performance to average producers in the area.
Use data in farm planning
Benchmarking information can also be retrieved from the FINBIN database at the University of Minnesota’s Center for Farm Financial Management.
You can make whole-farm and enterprise-level comparisons with several financial and production measures to see where you stand against the average, as well as those in the low 20%, middle 40% to 60% and high 20% levels of profitability.
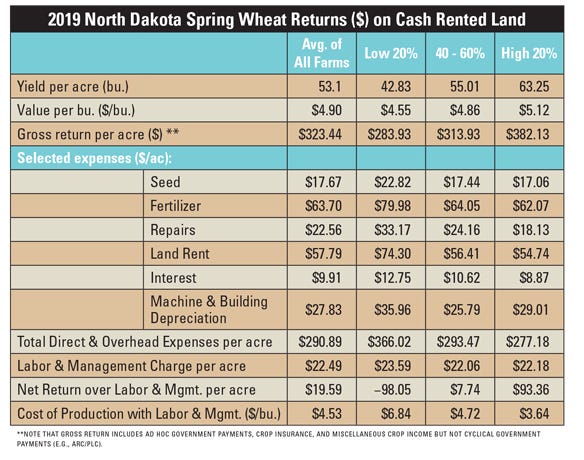
The chart below shows 2019 spring wheat returns from 145 enterprises on cash-rented land in North Dakota.

You can see that spring wheat gave an average net return over labor and management of $19.59 per acre with returns of −$98.05 per acre, $7.74 an acre and $93.36 per acre for the low, middle and high 20% profitability groups, respectively.
Yields, prices, crop insurance, government payments and costs can all be analyzed at each profitability level to see where your operation fits. For instance, in regards to profitability:
low 20% averaged 42.83 bushels per acre at $4.55 per bushel
high 20% at 63.25 bushels per acre at $5.12 per bushel
average at 53.10 bushels per acre at $4.90 per bushel.
This information can also be used to make marketing decisions. When looking at the same spring wheat enterprise, we see the cost of production was $6.84 per bushel for the low 20% profitability level, $3.64 per bushel for the high 20% and the average was $4.53 per bushel. Knowing the cost of production is important when developing a marketing plan. If your costs are higher than the current selling price, evaluate your opportunities to lower costs or boost production. Benchmarking costs such as fertilizer, seed, land rent or machinery costs can help with these decisions.
Benchmarks subject to change
While benchmarking is useful to assess problems, use care to consider variables that can change each year and create anomalies. Extreme weather is one of the most common causes of drastic changes from year to year and can often make it difficult to benchmark yields or profits. It may be useful to benchmark three- or five-year averages to “normalize” results.
Note that economies of scale, farm size and type of farm can affect some benchmark values. For instance, benchmarking a crop farm against a livestock farm is not likely useful because of the differences in production, commodity price cycling, costs and returns. Benchmark crop and livestock enterprises separately to make fair comparisons.
For more information on the North Dakota Farm Management Education Program, contact Craig Kleven, state supervisor for ag education, at [email protected] or 701-328-3162.
Fellwell is an instructor for the North Dakota Farm Management Education Program. He writes from Jamestown, N.D.
You May Also Like


