September 29, 2021

Each year, the USDA National Agricultural Statistics Service conducts a nationwide survey to gather data and compile a report showing average cash rental rates across the United States.
To view the database with the data for each state, click here. To view the database with data for each county in the US, click here. To view the report for Texas, broken down by region and county, click here. Please note that all reported cash rent amounts are listed in a per acre/per year format.
Here’s how things broke down in the Lone Star State. To see the average lease rates for your county in Texas, click here.
Pastureland
The highest pastureland rental rates were reported in Wharton County at $20.50/acre and Falls County at $20.00/acre. The lowest pastureland averages were in Hudspeth and Winkler Counties, reporting $0.40 and $0.90/acre, respectively. The statewide average for Texas came in at $7.10/acre, which is a $$0.10 increase from last year.
Irrigated Cropland
The highest average reported rate for irrigated cropland was $153.00/acre in Sherman County. The lowest reported rate for irrigated cropland came from Carson County at $38.50/acre. The statewide average for Texas was $100/acre, up $5.00/acre from last year.
Non-Irrigated Cropland
The highest reported average rental rate for non-irrigated cropland is found in San Patricio County at $78.50/acre, followed by Nueces County at $67.00/acre. The lowest reported rates were in Sutton County at $5.60/acre and Kendall County at $7.60/acre. The statewide average was reported at $30.00/acre and remained unchanged from 2020.
District Summary
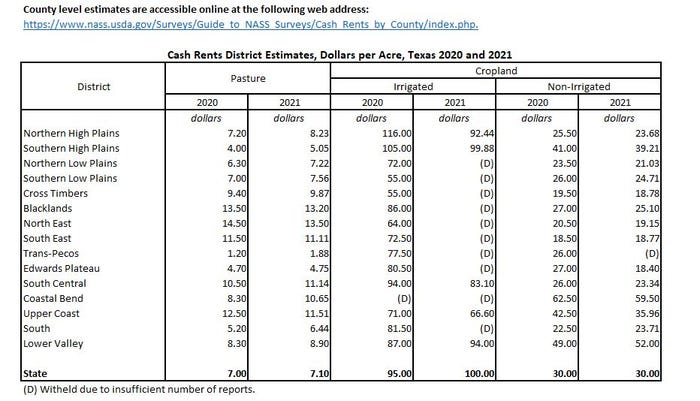
Greg Kaase, Texas A&M AgriLife Extension program specialist, pulled together the following table showing the average cash lease rates for 2020 and 2021 for each of Texas’ regions.


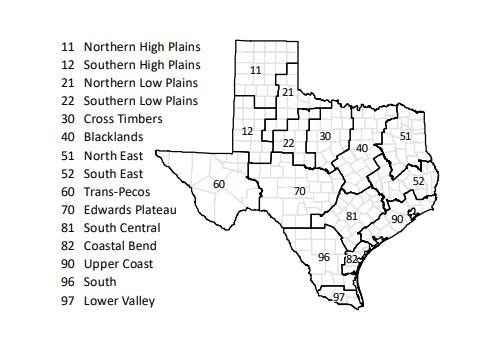
Map provied by USDA NAAS
More Information
For more information on agricultural leases, we’ve got a number of other resources. If you’d like to see another report that includes average lease rates, click here to see a blog post about the Texas Rural Land Value Trends Report. To read about agricultural leases, check out Chapter 11 of the Owning Your Piece of Texas Handbook or our Ranchers Agricultural Leasing Handbook. We also have podcast episodes specifically discussing grazing, farm, and hunting leases. Lastly, we’ve got a course specifically geared to grazing and hunting leases that is available in person or online.
Source: is Texas Agriculture Law Blog, which is solely responsible for the information provided and is wholly owned by the source. Informa Business Media and all its subsidiaries are not responsible for any of the content contained in this information asset.
Read more about:
Cash RentAbout the Author(s)
You May Also Like


