June 2, 2020

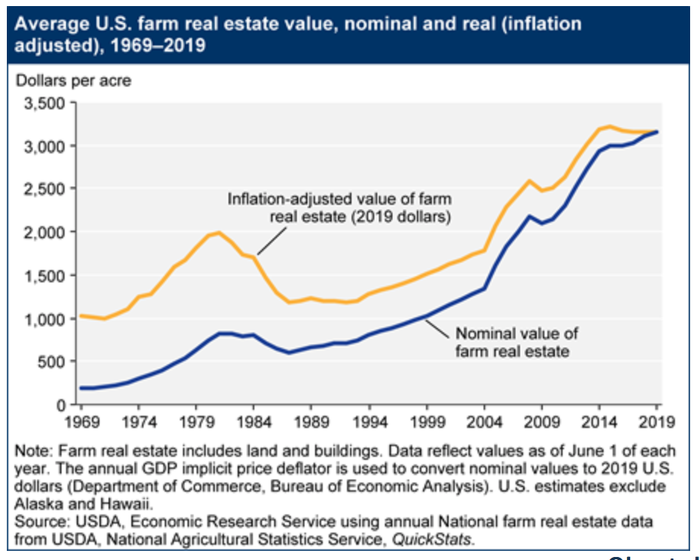
Farmland values have stabilized since 2014, following a long trend of appreciation that began in the 1980s, according to USDA's Economic Research Service. However, there is a regional variation in both farmland value levels and growth trends. In recent years, farm real estate has typically accounted for about four-fifths of the total value of U.S. farm assets.
In 2019, U.S. farmland value averaged $3,160 per acre, an increase of .2% over 2018. While nominal farmland values haves increased modestly since 2016, real (inflation-adjusted) farmland values have remained flat since 2014.
Regional farmland real estate values vary widely because of differences in general economic conditions, local farm economic conditions, government policy and local geographic conditions that affect returns to farming.
Farm real estate growth trends also vary by region. Between 2018 and 2019, inflation-adjusted farm real estate values fell:
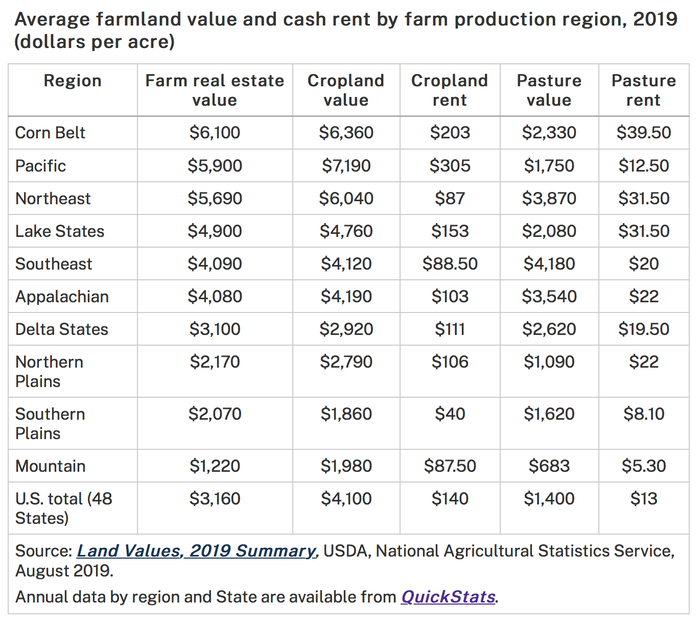
1.9% to $6,100 per acre in the Corn Belt;
1.5% to $4,900 per acres in Lake States; and
.8% to $4,090 per acre in the Southeast.
By contrast, farm real estate values appreciated in:
The Pacific, up 3.3% to $5,900 per acre;
The Southern Plains, up 1.7% to $2,070 per acre; and
The Delta States, up 1.5% to $3,100 per acre.
Over 2015-19, inflation-adjusted farmland real estate values in the Pacific, on average, have appreciated 14.5%, the most for any region, while values in the Southern Plains appreciated 6.6%. In contrast, farm real estate values fell by 12.8% in the Northern Plains and 8.6% in the Corn Belt.
Farmland real estate values vary according to agricultural use. Cropland maintains a premium over pastureland. Changes between 2018 and 2019 also varied according to use. U.S. average cropland value fell by 0.5% to $4,100 per acre in real terms, while pastureland value rose by 0.4% to $1,400 per acre.

Cropland vs. pastureland
The difference between cropland and pastureland values vary considerably by region. Cropland values are higher than pastureland values in every region except for the Southeast. In the Pacific region, cropland was worth four times as much as pastureland in 2019 ($7,190 vs $1,750.)
Growth rates in cropland values vary across regions. Since 2015, cropland values have increased in the Pacific (8.2%) and Delta (4.7%), after adjusting for inflation. Cropland values decreased over the same time period in the Northern Plains (-15.9%), Corn Belt (-11.5%), and the Lake States (-6.2%). Pastureland value increased in in the Delta States region by 4.8% from 2015-19. In contrast, pastureland values fell in the Corn Belt (-9.2%), Lake States (-5.4%) and Appalachia (-3.3%).
Rental rates
Between 2018 and 2019, average U.S. cropland rental rates decreased by -0.3%, to $140 per acre. Pasture rental rates, on the other hand, increased by 2.2%, to $13 per acre.
Between 2018 and 2019, cropland rental rates increased the most in the Pacific (up 10.2% to $305 per acre), Northeast (up 6.2% to $87 per acre), and Southeast (up 2.9% to $88.50 per acre). Cropland rental rates fell in the Mountain States (down 5% to $87.50 per acre), Corn Belt (down 2.2% to $203 per acre), and Lake and Delta States (down 1.7% to $153 and $111 per acre, respectively).
Pastureland rental rates increased the most in the Delta States (up 6.5% to $19.50 per acre), Northern Plains (up 2.9% to $22 per acre), and Pacific (up 2.4% to $12.50 per acre). Pasture rental rates fell by 15.2% in the Northeast and 9% in the Lake States, to $31.50 per acre in both cases.
From 2015-19, cropland rental rates have declined in most regions in real terms, falling by over 9% in the Northern Plains, Corn Belt, Lake States, and Mountain regions. In contrast, cropland rental rates increased in the Northeast (6.7%) and the Pacific (8.5%). Over the same time frame, pastureland rental rates increased 3.5% in the Southeast region, while falling in the Northern Plains (-14.6%) and Pacific (-13.7%).

Source: USDA ERS, which is solely responsible for the information provided and is wholly owned by the source. Informa Business Media and all its subsidiaries are not responsible for any of the content contained in this information asset.
You May Also Like


