Subscribe to receive top agriculture news
Be informed daily with these free e-newsletters

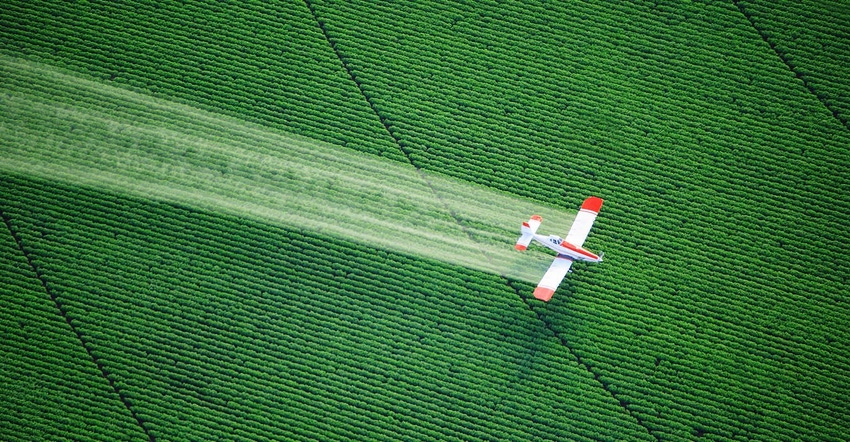
The top five states for aerial application business headquarters are Texas, Minnesota, Arkansas, Louisiana, California and Nebraska.
May 28, 2019
The 2019 National Agricultural Aviation Association Aerial Application Industry Survey confirms aerial application is as vital to modern agriculture as it has ever been—and the industry's footprint is expanding.
Among the findings:
The number of agricultural aviation operations has grown 16% since 2012. NAAA concluded there were approximately 1,350 aerial application businesses in the United States in 2012 and 1,560 today.
The number of hired pilots is up 42% from 2012. In 2012, there were an estimated 2,700 total ag pilots, including 1,430 hired pilots. In 2019, there are 3,385 total ag pilots, including 2,028 hired ag pilots.
Operators are, on average, two years older than they were in NAAA's 2012 survey (55 now versus 53 then), the population of owner/operators under 40 grew from 11% in 2012 to 15% in 2019. Employee pilots are younger today, too. Pilot respondents were 47.4, on average, two and a half years younger than in 2012 when their average age was 49.9. The largest cohort of hired pilots (25%) was in the 30–39 age bracket in the 2019 survey. Furthermore, the population among all hired pilots under 40 grew to 39%, up from 26% in 2012.
Operator participants in the 2019 NAAA industry survey were headquartered in 42 states, but according to NAAA's records, aerial application operators are based in 45 states and aerial applications are conducted in all 50 states. The top five states for aerial application business headquarters among the operator respondents were: 1) Texas, 2) Minnesota, 3) Arkansas, 4) Louisiana and 5) California and Nebraska (tied).
The average number of aircraft per operation is up nearly 10%. During normal day-to-day operations, operators have an average of 2.17 pilots and 2.3 aircraft per operation. That's up 9.5% from the 2.1 aircraft per operation reported in the 2012 survey. Fixed-wing aircraft account for 84% of the fleet, and helicopters make up 16%. That's a slight change from the 2012 survey when the proportion of fixed-wing aircraft and helicopters was 87% and 13%, respectively. Seventy-one percent of helicopters are turbine powered and 83% of the fixed-wing aircraft are turbine powered.
It’s estimated the agricultural aviation industry treats an estimated 127 million acres of cropland aerially annually.
According to the 2017 USDA Census of Agriculture, there are 347 million acres of cropland in the U.S. Considering some crops are treated more than once during a season, aerial application treats an estimated 28% of this cropland.
Ninety-nine percent of operators use a GPS device for swath guidance, according to the 2019 operator survey. Eighty-one percent of their aircraft are equipped with smokers to determine wind direction and estimate wind speed. Sixty-four percent of ag aircraft have liquid flow control equipment and 30% have dry flow control equipment. Liquid and dry flow control equipment can be used to make precision constant rate and variable rate applications.
Corn, small grains such as wheat and barley, soybeans, pastures and rangeland, and alfalfa were the five most common crops treated during the 2017 season, in that order. When asked to estimate the usual and maximum number acres treated in a single day with a single aircraft for a variety of crops, the highest averages in terms of the usual number of acres a single aircraft treats in a day were applications to corn (1,165 acres), forests (1,149 acres), soybeans (1,143 acres), cotton (1,125 acres) and rice (1,033 acres). In most instances, the average acres treated per day among 12 crop categories were higher in NAAA's 2019 industry survey than in its 2012 survey.
Operators and pilots view power lines, communication towers and meteorological evaluation towers as the top three occupational hazards. Fifty-nine percent of operators in the 2019 survey encountered an unmarked communications tower while spraying, and 52% encountered a wind turbine or unmarked meteorological tower. Meanwhile, 15% of operators reported encountering a drone while making an aerial application.
Nearly 70% of aerial application companies conduct flight operations more than 100 days a year. Forty-three percent of operators flew between 100 and 200 days in 2017, 25% flew more than 200 days, 24% flew 50 to 100 days, and 7% flew fewer than 50 days during the 2017 season. More than half of operators (55%) work 8 to 12 hours per day in season, and more than a third (35%) reported working an average of 13 to 16 hours per day during the application season. Pilot responses were almost identical.
The survey process
NAAA surveyed member and non-member Part 137 operators and pilots from Jan. 26 to April 29, 2018.
The survey was administered on NAAA's behalf by survey scientist Tim Struttmann and supported by the Southwest Center for Agricultural Health, Injury Prevention, and Education in Tyler, Texas. A total of 550 operators and 305 pilots responded to the web-based survey, which was modeled after a similar web-based survey in 2012 and paper-based surveys in 1992, 1994, 1998 and 2004. The response rate was 35%.
Source: National Agricultural Aviation Association, which is solely responsible for the information provided and is wholly owned by the source. Informa Business Media and all its subsidiaries are not responsible for any of the content contained in this information asset.
You May Also Like
Enter a zip code to see the weather conditions for a different location.


