
China had announced some weeks earlier that July 6 would be the date it began to impose 25% tariffs on U.S. soybeans in retaliation to various U.S. tariffs aimed back at China. That left U.S. export sales reported between June 22 and 28 as one of the last full weeks to do so ahead of these geopolitical moves. And traders expecting a flurry of soybean export sales leading up to today’s date were not left disappointed – although China did not end up being a major part of that mix.
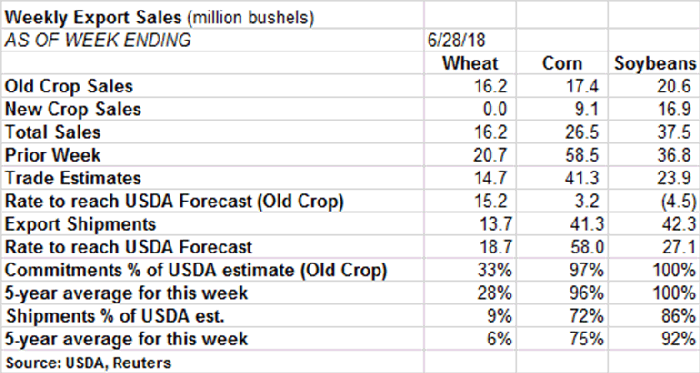
Soybean export sales found 20.6 million bushels in old crop sales, plus another 16.9 million bushels in new crop sales for total sales of 37.5 million bushels. That hovered just above the prior week’s sales of 36.8 million bushels and landed moderately higher than trade estimates of 23.9 million bushels. Soybeans continue to expand its “lead” over USDA forecasts for the 2017/18 marketing year, now exceeding that count by 4.5 million bushels per week.
Soybean export shipments reached 42.3 million bushels, which was 87% higher than the prior week and bested the four-week average by 49%. The Netherlands was the No. 1 destination, with 6.0 million bushels, followed by Mexico, Pakistan, Bangladesh and Japan. China was conspicuously absent from last week’s list of top destinations.
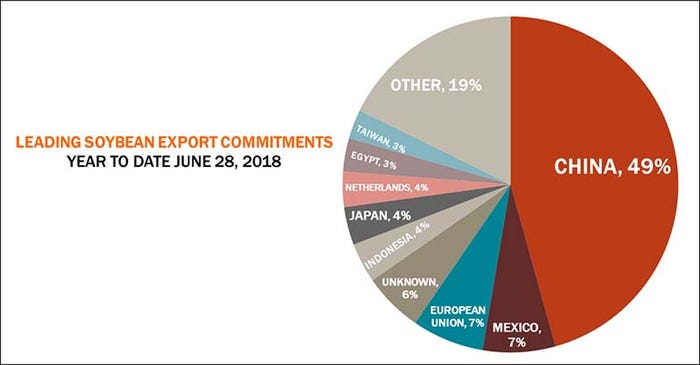
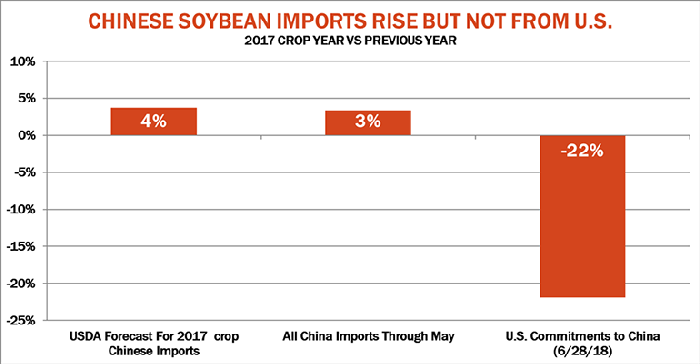
“China cancelled more sales ahead of tariffs that went into effect today, taking 134.5 million bushels off the books, while accepting a scant 52,000 bushes, one cargo’s worth,” notes Farm Futures senior grain market analyst Bryce Knorr. “China now accounts for only 49% of total U.S. soybean commitments; normally the figure is 57% to 62%. Total U.S. sales and shipments to China are down 22% year-to-date.”
While some of those cancellations were switched to other destinations, some were not – leaving the impact of the tariffs uncertain for now, Knorr adds.
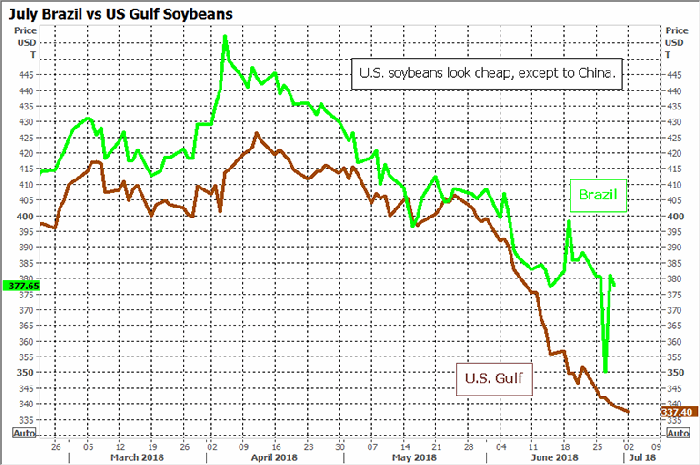
“However, October export prices show U.S. soybeans delivered at a 20% discount to Brazil, closing in on the level needed to make them work into China even with the tariff,” he says.
Corn exports found 17.4 million bushels in old crop sales last week, plus another 9.1 million bushels in new crop sales, for a total of 26.5 million bushels. That was less than half of the prior week’s tally of 58.5 million bushels and moderately lower than trade estimates of 41.3 million bushels. The weekly rate needed to reach USDA’s 2017/18 forecasts was trimmed again to a very manageable 3.2 million bushels.
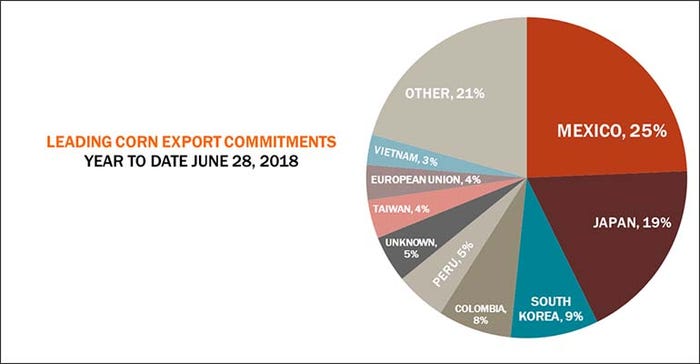
Corn export shipments reached 42.3 million bushels, which came in very close to both the prior week’s total (2% higher) and the four-week average (1% lower). Mexico was the No. 1 destination, with 15.5 million bushels, followed by Japan, Taiwan, South Korea and Egypt.
Wheat exports last week saw 16.2 million bushels in sales, which was moderately lower than the prior week’s total of 20.7 million bushels but moderately higher than trade estimates of 14.7 million bushels. The weekly rate needed to reach USDA’s forecasts eased slightly, to 15.2 million bushels.
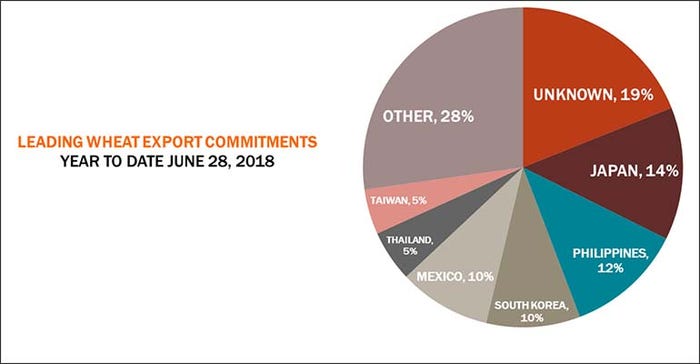
Wheat export shipments of 13.7 million bushels are not keeping pace with the weekly rate needed to reach USDA forecasts, however – now at 18.7 million bushels. South Korea was the No. 1 destination, with 2.3 million bushels, followed by Thailand, the Philippines, Taiwan and Mexico.
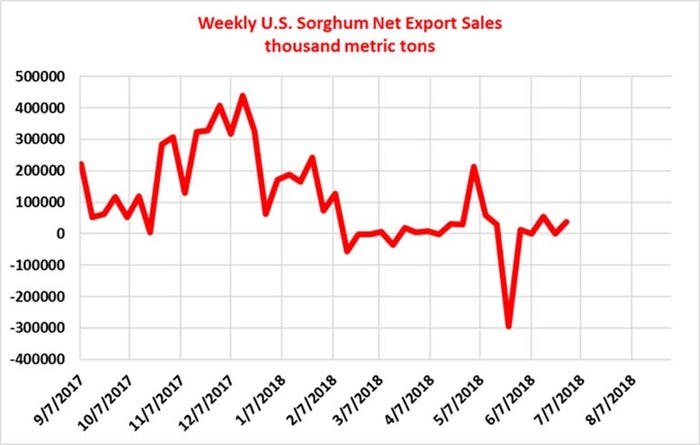
Sorghum sales last week reached 1.5 million bushels, as increases for Mexico and South Africa more than offset reductions from unknown destinations. South Africa also took around 362,000 bushels in export shipments last week.
This interactive map has complete results from the latest USDA Export Sales report for corn, soybeans and wheat, showing sales, shipments and accumulated totals for the current marketing year (CMY) and next marketing year (NMY). Click the box in the upper left-hand corner of the map to display a legend. Click the crop you want to look at to explore data from individual countries. All figures are listed in metric tons.
About the Author(s)
You May Also Like


