Subscribe to receive top agriculture news
Be informed daily with these free e-newsletters

Season long aerial images guide prescriptions for variable rate planting, nitrogen, cover crops
September 12, 2018
When Brian Sutton started using aerial thermal images to manage his western Indiana farm seven years ago, he saw their value in early detection of diseases in corn and soybean fields. The flying farmer’s use of thermal, visual and AVDI images has now evolved from a scouting tool to driving prescriptions for a number of variable rate applications, and he’s formed a company that allows other farmers to take advantage of what he’s learned.
----------------
Brian Sutton could make the case that he knows his own farm as well as any farmer in the country. He has 20 years of yield history, every type of soil test known to man, and seven years of season-long aerial photography at two-week intervals.
You might think all that information could complicate the management decisions he and his brother Dan make on their 1,400 acres of corn and soybeans each year. Instead, he says it simplifies decisions in using variable-rate technology to make the most of seed, fertilizer, cover crops and other crop inputs.
“A thermal aerial photo from the drought of 2012 showed me where my drought-prone soils are, and I made a planting prescription from that photo last year. I used a multi-hybrid Precision Planting meter on my planter that pulls from two different boxes, planting a workhorse variety in the dry areas and racehorse corn in the areas not so susceptible to drought,” Sutton explains.
He thinks the system paid for itself in higher yields last year alone, with 15 bushel per acre higher yields on the good soils with racehorse corn. It was also his defense against drought, using workhorse corn on the drought-prone areas of the field.
“I’m going to do that every year going forward now, and may get a little more aggressive,” Sutton says. He also increases seeding rates on the areas with highest potential as defined by his imagery. “I think I have a good handle on the seed corn germplasm that suits my ground—that’s the first thing,” Sutton says. “Using that germplasm, I’ve done trials of racehorse and workhorse varieties, and found that when I have even small areas of a field that can support racehorse corn, I need to be sure I get it planted there in order for those areas to reach their full potential. This technology allows me to do that, and still avoid disasters associated with having racehorse corn on marginal ground,” he says.
Sutton now offers the aerial imagery work he does on his own farm as a service to farmers across the Midwest. He and his brother Dan founded AirScout, a company that’s helping farmers throughout the Midwest make decisions based in part on a series of aerial images. He has planes based in Colorado, Nebraska, Iowa, Illinois, Indiana, Ohio, Michigan, Wisconsin, and Georgia. Farmers can buy AirScout’s aerial image services through local agronomy businesses or cooperatives.
Here’s how it works. Every two weeks, a pilot flies your fields. With each flight, you get a visual, thermal, and ADVI photo. “It’s a check on your field’s health,” Sutton says. “It’s like human health—you need an x-ray for some things, but a different kind of photo, a CT-scan or MRI to learn about other issues,” Sutton says. “One thing I’ve learned is you can’t skimp on the flights. We don’t offer just one or two flights over the season because a single flight in the middle of the summer is out of context—I know from experience you need the whole season to make informed decisions,” Sutton says.
“When you have the entire season, you can scroll back in time to see what happened and when. That tells you what you can do differently the next season and possibly avoid some of the same mistakes,” Sutton says. He knows from experience on his own farm.
Despite all the tools Sutton has to develop planting prescriptions, he uses only the best bare soil ADVI (Advanced Difference Vegetative Index) image available to make a population prescription for planting. “The soil has to be dry when the photo is taken, to reflect differences in organic matter rather than moisture,” Sutton says. “It can be taken any time up until corn is 6 inches high, on either a tilled or no-till field. I check it against a thermal photo taken at the same time to be sure it is not skewed by moisture.”
Once he gets a good “base” bare soil ADVI photo, he can use it for years, Sutton says. “It’s essentially a relative organic matter photo that can be used as the basis for variable rate prescription planting,” Sutton says. “Because of its ability to see differences in bare soil, the ADVI photo I use has taken NDVI imaging technology to the next level, where it enables extremely refined planting prescriptions. I have a drive on every row of my planter, and I know if I lay down a high-resolution zone, my controller can execute it. If I can use one photo to make an accurate map that shows relative soil potential for yield (relative organic matter) that I can use for years, that’s about as simple as I can make prescription planting,” Sutton says.
“As I’ve compared lush areas of my fields with aerial photos from year to year, I’ve realized that maybe 10% of the field is always low and 10% is always high, but 80% of the field flip flops from year to year due to rainfall. What I want to do is put more nitrogen on the areas that have the most potential to produce the highest yields, but I don’t know where those areas will be at the start of the season,” Sutton says. “So I try to make sure the corn never has a bad day—with enough N to get it out of the ground, then enough for a good start, and then more to the areas with the highest potential as defined by the imagery later in the season.”
His simplified plan is to apply 70 pounds of N upfront—40 lbs. pre-plant and 30 lbs. starter with the planter, including N in a 2” x 2” offset and dribble starter in the furrow. That’s followed with a blanket of 70 pounds of N at the v5 to v8 stage. Then Sutton watches the corn grow through June and July to see how the crop is shaping up. He looks at aerial ADVI photos in late June—which indicate biomass—to base decisions on more fertilizer on the healthiest plants.
“I already have 140 pounds of N on the whole field, so I know all the corn has enough N up to that point. I’m looking for the ‘happy’ areas of the field, the ones with higher yield potential at this time of year,” Sutton says. He believes farmer intuition at this time is better than any model, but since they can’t see the whole field from the ground, they need a look from the air to identify areas with not only the highest yield potential, but the incremental variation in the field for variable rate N purposes.
“By the time I need to make a final decision about nitrogen, I have seen April, May, and June pass by. I know my current moisture level, and I know the 10-day forecast. Now I make an estimate on the potential yield of each zone derived from the ADVI imagery, and how each area is mineralizing nitrogen, and I build a prescription to apply 28% liquid nitrogen variable rate with a Hagie and Y drops,” Sutton says. “That’s much better than making a guess on nitrogen at the start of the season.” AirScout’s service includes a “Prescription” building tool at no cost.
Sutton partnered with Hagie back in 2015 to build a special “AirScout Edition” machine that is capable of applying two different products at the same time, using two different prescriptions. This enables him to apply fungicides or foliar feed in the same pass as the last nitrogen fertilizer application. “If I see hotspots in the most recent aerial thermal image but the visual photo shows what looks like a healthy crop, I know there’s stress and a problem coming from the ground up,” Sutton says. “So I’ll scout to see if there’s a disease problem. If there is, I can apply a fungicide or foliar feed according to a prescription made from the thermal image. Since this is all done in the same pass as the late season nitrogen application, fungicide and foliar feeds are free passes for me.”
Sutton’s customers also use the thermal images for irrigation decisions and monitoring. “Many of my clients have found uneven distribution of water on center pivot systems with thermal images, and they’ve been able to fix a problem before it impacted yield,” he says. The AirScout prescription building tool allows an irrigator to break the field up into “pie” slices for variable rate irrigation. “This is normally used with a thermal picture that defines the zones by how hot they are, and allows you to direct more water to the dry zones and less to the wet zones. It’s been extremely beneficial from an environmental standpoint, and especially helpful to farmers who are limited on how much water they can use,” says Sutton.
After using his aerial images for a few years, Sutton found a surprise use that helps with marketing his crop. “I just stumbled onto that one,” he says. “I began to notice that my thermal photos after canopy started looking a lot like my yield maps,” Sutton says. “I’d look for areas of crop stress and areas with a lot of biomass to get a pretty good idea of what the yield might look like in the fall.”
He developed a simple yield calculator program that he passes along to AirScout customers for free. “What the program does is drop three pins onto the photo of a field, in the hottest, coldest and mid temperature areas. Those three pins represent your worst, best, and mediocre areas of your field, and are your best places to make physical yield checks,” Sutton says. “Then the program quantifies yields based on how much of the field is represented by each sample. The calculator has been within 5 bushels per acre of the actual yield.”
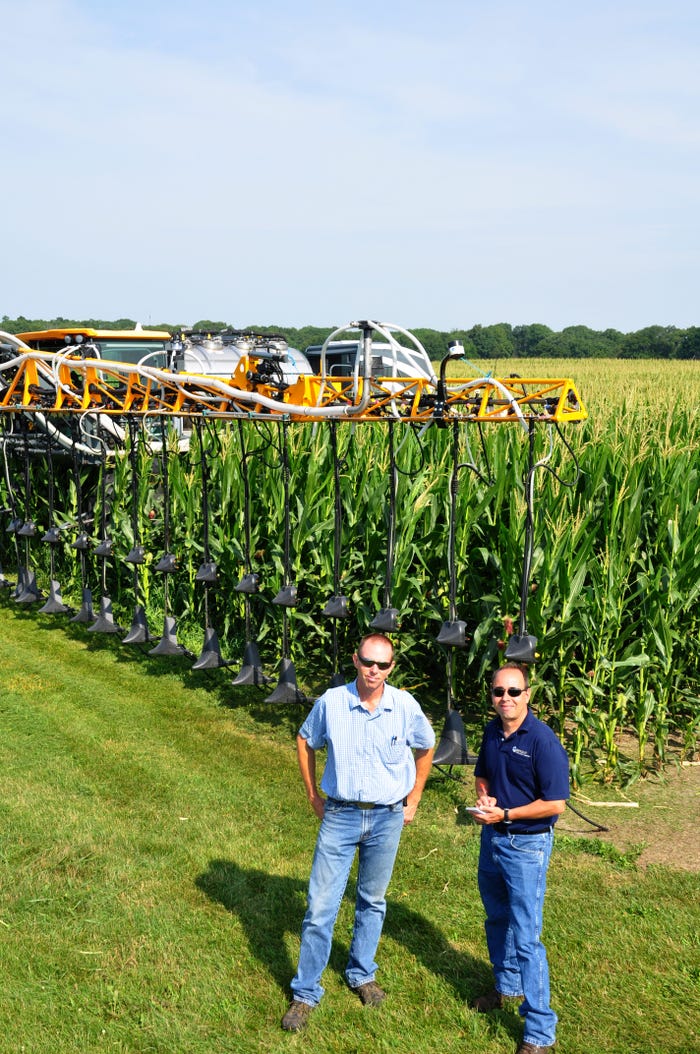
Sutton started using cover crops seven years ago, and now uses them on every acre of corn and soybeans. Like others with a Hagie highboy sprayer, he’s making full use of it by seeding cover crops into growing corn to give them an earlier start in the fall.
What Sutton is doing differently than most, though, is using the Hagie to vary both the rate and species of cover crops, to reach goals for different areas of the field. The prescription for seeding comes from an aerial photo Sutton already had on hand—essentially the same relative organic matter photo that he used earlier for variable rate prescription corn planting. He’s excited about the potential for variable rate and species of cover crops.
In late August, Sutton takes the wet tanks and hoses off his Hagie, and adds two dry boxes and a seeder he and Dan built specifically to seed cover crops using prescriptions from their AirScout imagery. They’re seeding their own land and also custom seed cover crops for neighbors.
“We want to control erosion and build organic matter in the low producing areas, like hillsides, so we’ve doubled the rate of grass seed or cereal rye for those areas,” Sutton says. “But on the lower areas we want to scavenge nitrogen and reduce compaction, so we’ll use turnips and radish seed in a mix with clovers. It’s a waste of seed to use the turnips and radishes on our poor soils that won’t allow good penetration and have little nitrogen to scavenge; varying the species is something new that I think shows a lot of promise.”
He also uses the late season visual imagery to guide him to differing areas of senescence for pulling stalk nitrate samples. “Without knowing what you left on the table, how can you be confident your nitrogen program is actually correct?” asks Sutton. “My goal is to see the entire field senesce down evenly. I think that’s much harder than anyone can imagine, and would be impossible for us to monitor without the imagery.”
From planting to harvest, the thermal images guide his decision-making. Sutton says mapped soil temperatures across the field from thermal images in a wet spring help guide replant boundaries, and thermal images also guide when and where he can harvest. Sometimes it’s as simple as staying out of the mud. “We no-till, and we don’t want to mud up our fields or cause compaction or ruts at harvest,” Sutton says. “In the wet fall of 2016, I used thermal images to find drier areas of the field to harvest. I was running from spot to spot to harvest on solid soil. I think the neighbors thought I was on something, but it wasn’t random. I got more soybeans out of the field in a timely way using the October thermal image to guide me.”
AirScout, Inc. is based at Bult Field in Monee, Illinois, near Sutton’s farm in Indiana. The cost is typically $7 to $9 an acre per year for a series of 8 to 14 flights and includes the prescription and yield estimation tools.
For website demos, photos, and more information on both aerial images and ground application services at selected locations, visit AirScout.com
You May Also Like
Enter a zip code to see the weather conditions for a different location.