March 13, 2020
Since the end of 2014, dairy farmers in the U.S. and throughout the world have struggled with low prices resulting from large supplies outweighing demand. In 2019, several dairy operators decided it was time to exit the industry. USDA's National Agricultural Statistics Service’s monthly Milk Production report, released on Feb. 20, showed the largest annual decline in the number of licensed dairy operations since 2004.
Dairy herd and milk production
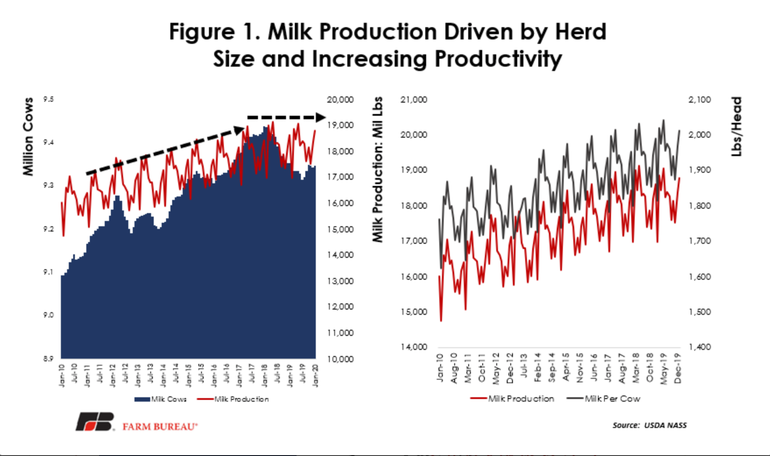
Annual milk production in the United States in 2019 was 218.4 billion pounds, increasing 0.4% from the 217.6 billion pounds produced in 2018. Milk production in the U.S. has grown every year over the past decade, but that growth has somewhat leveled off the last few years. 2019 year-over-year growth represents the slowest growth since 2013, when production grew 0.3% from 2012.
Annually, the U.S. has seen the average number of milk cows decline since 2017, from an average of 9.406 million head to an average of 9.336 million head in 2019. However, the growth in milk production has only slowed, not declined. This is due to the ever-increasing productivity of the milking cows. Milk produced per cow in the U.S. averaged 23,391 pounds for 2019, 241 pounds above 2018’s 23,150. Unlike the fluctuating overall number of cows, milk production per cow has steady increased approximately 10.6% from 2010.
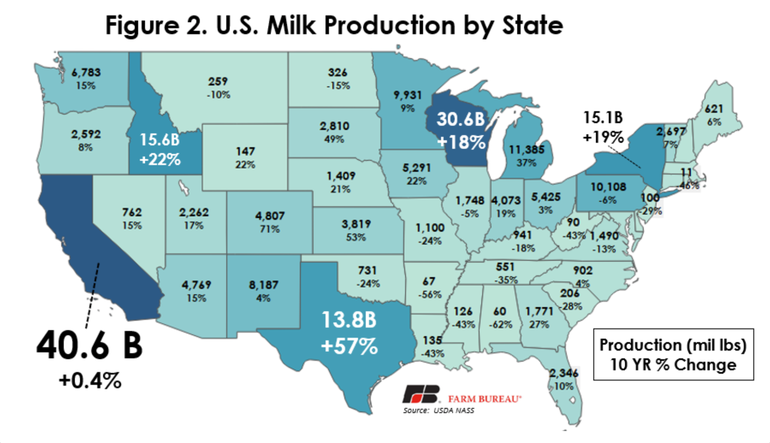
California is the largest milk-producing state in the U.S., clocking in at 40.6 billion pounds. The state is followed by Wisconsin, Idaho, New York and Texas, with 30.6, 15.6, 15.1 and 13.8 billion pounds, respectively. Growth in production over the past decade has not been evenly distributed; while production has grown in most of the country, it has declined since 2010 in the Southeast. Colorado has experienced the largest growth in percentage terms, growing 71%. Growth in Texas has been stupendous, rising 57% since 2010 into the fifth largest milk-producing state in the country.
The decline of licensed dairy herds
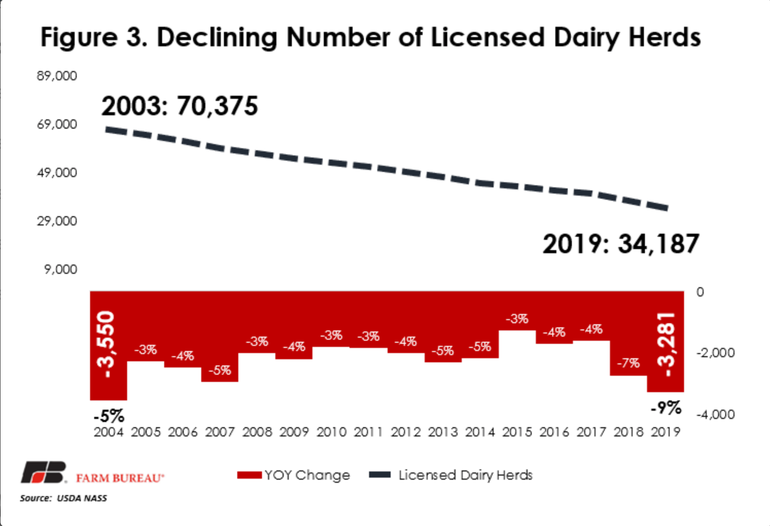
This Milk Production report also showed the largest year-over-year decline in the number of licensed dairy operations since 2004, and the largest year-over-year percentage decline since 2003, the first year for which the data is available. There were 3,281 fewer licensed dairy operations in 2019 than in 2018, when the number dropped by 2,731. The overall number of licensed operations in the U.S. has marched steadily downward since data collection began, declining by more than 50%, from 70,375 in 2003 to 34,187 in 2019.
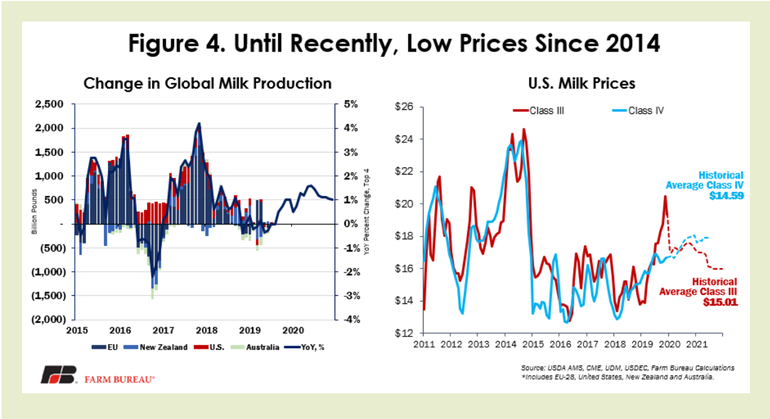
The recent acceleration of the decline reflects how difficult it is to operate a dairy, particularly in the last several years. However, toward the end of 2019, milk prices surged to levels not seen since 2014. These prices were a function of increasing milk powder prices along with higher cheese prices helping to lift both Class III and Class IV milk prices.
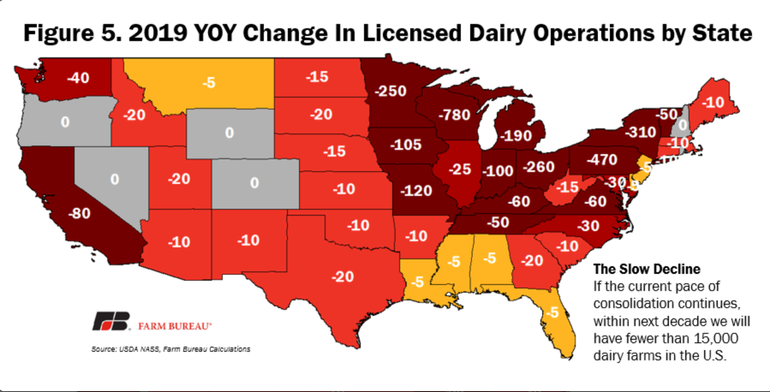
No state registered an increase in licensed dairy operations from 2018 to 2019. In terms of the decrease in the number of licensed operations, Wisconsin led the country with 780 fewer operations in 2019 than a year earlier. Following Wisconsin was Pennsylvania, New York, Ohio and Minnesota, with declines of 470, 310, 260 and 250, respectively. The Upper Midwest and the Eastern Corn Belt lost the most licensed dairy farms.
Source: AFBF, which is solely responsible for the information provided and is wholly owned by the source. Informa Business Media and all its subsidiaries are not responsible for any of the content contained in this information asset.
You May Also Like


