


Subscribe to receive top agriculture news
Be informed daily with these free e-newsletters

This morning, USDA’s 99th annual Agricultural Outlook Forum kicked off in Arlington, VA. USDA’s World Ag Outlook Board, the entity that publishes the monthly World Agricultural Supply and Demand Estimates report, published a first look at 2023 production and usage estimates that will be widely discussed until USDA’s National Agricultural Statistics Service releases its March 31 Prospective Plantings report.
Below is a nuts-and-bolts summary of how key metrics regarding acreage, production, and usage were reported in this morning’s report as well as some economic analysis to provide more context.
I have also prepared a summary of Chief Economist Seth Meyer’s outlook presentation that provides even further context about the global and domestic factors impacting these estimates.
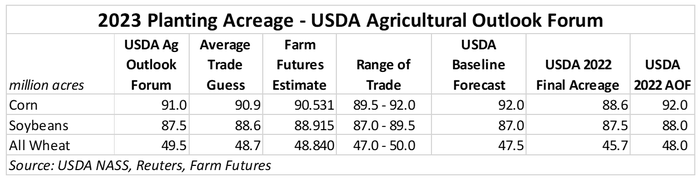
Amid a surge in winter wheat acreage planted last fall, and specifically more soft red winter wheat acres in key Eastern Corn Belt states, USDA’s WAOB made some unusual deviations from its Fall 2022 Baseline Projection acreages for corn, soybeans, and wheat.
WAOB cut 1 million acres of corn from its 2023 baseline estimate, which now stands at 91.0 million acres. While that still marks a 2.7% annual increase in corn acreage, it suggests that acreage expansion will be limited this year even as crop budgets project profitable returns to corn. Markets currently favor corn acres, though the price ratio is not showing an explicit preference between corn and soybeans for 2023.

Soybean acres are expected to remain nearly the same as last year, at 87.5 million acres. Wheat acres jumped up much higher than the trade was expecting to 49.5 million acres on the heels of a massive winter wheat expansion last fall. If realized, it will be the largest wheat acreage sown since 50.1 million acres of wheat were planted in the 2016 growing cycle.

USDA’s Chief Economist Seth Meyer expects that the acreage race is in a similar place as the same time last year, which means that weather will have the final say in how 2023 acreage shakes out. But as the new projections stand, total acreage for the three principal crops (228.0M ac.) will rise 2.8% higher than last year if “normal” weather conditions persist through this spring.

USDA held firm on its baseline yield forecasts, calculated from trendline estimates. WAOB’s estimates do not include any deviations from trendline yields due to potential weather shocks, so yield forecasts for all three crops are between 5%-6% higher than last year’s totals, which were plagued by a late start and subpar moisture conditions during the growing season.
Considering that most of the major hard red winter wheat growing area remains in drought, the wheat yield estimate may be a stretch. But as La Niña winds down and WAOB applies its “normal weather” assumptions, that forecast could be reached if drought conditions on the Plains lift in the coming months.
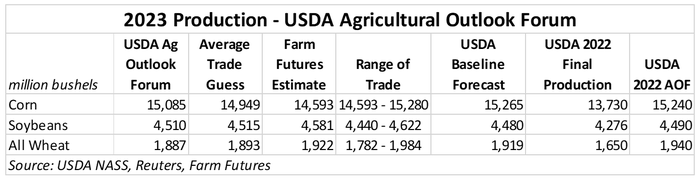
The return to “normal yields” will help boost production after several consecutive years of crop shortfalls. That puts its estimates for 2023 corn production at 15.085 billion bushels, a 10% increase from last year’s crop that will narrowly unseat 2021 as the second largest corn crop in U.S. history.
Soybean production for 2023 is forecasted at its largest on record and 6% higher than last year – 4.510 billion bushels. 2023 wheat production is projected at 1.887 billion bushels – up 14% from last year and the largest wheat crop harvested since 2019.
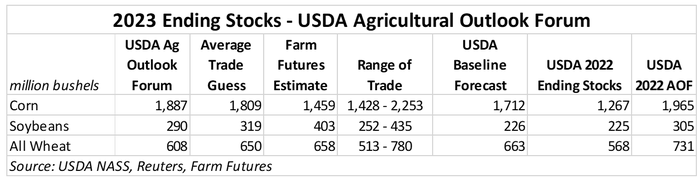
WAOB holds corn consumption for ethanol unchanged in 2023 from current 2022 levels (5.25B bu.) and plans for higher exports and feed and residual usage in the upcoming marketing year. But the large crop will help grow ending stocks to 1.887 billion bushels and could lift the dire supply constraints on the domestic corn market that have held prices so high.
As a result, USDA expects the seasonal average farm price in 2023 will drop to $5.60/bushel from the 2022 high of $6.70/bushel. Soybean prices will face a similar annual price drop in 2023, sinking to $12.90/bushel from 2022’s forecast of $14.30/bushel.
While soybean exports will only see a marginal increase in 2023 – though not likely back to 2020’s record volumes – the bigger opportunity for farmers will be closer to home in the coming year. Meyer expects soy crush capacity could increase by 25% in the next couple years, which justifies an annual increase in domestic crush volumes.
But even with a record-setting crop, the uptick in domestic demand will likely keep soybean stocks tight in 2023/24. USDA projects the 2023/24 soybean ending stocks-to-use ratio at 6.5%, which would be the 17th tightest supply on record for the U.S. soy complex. So even with a larger crop, prices will still have a bit of a floor during the 2023/24 marketing season.
Wheat supplies will increase slightly thanks to the acreage increase last fall. Slight usage increases are forecast for livestock feed and export volumes. But the past two seasons of consecutive crop shortfalls will also keep a floor under wheat prices in 2023/24.
WAOB predicts that the average farm price will drop $0.50/bushel from 2022/23’s record highs to $8.50/bushel in 2023/24. While that is not as severe as a drop as forecast for corn and soybean producers, it still represents stable profit opportunities for wheat growers in 2023/24.

Except for cotton, acreages for all crops are expected to increase in 2023/24. Hopes for improved weather conditions are a key driver of this expansion. Rice prices are finally more competitive with other grains as those prices ease, pushing more rice acres into production next year.
High input costs for cotton and reduced price competitiveness with other crop alternatives will be a key driver of lower cotton acreage in the coming months.
Prices are down from very high levels last year, but prices are still profitable for producers. “For a producer, what's going to matter is how do your input prices follow those output prices down,” Meyer foreshadowed.

Please keep in mind – these acreage estimates are NOT calculated from NASS farmer surveys, as the March 31 Prospective Plantings report is calculated. Rather, the acreage figures we saw this morning are calculated by USDA’s in-house economists at WAOB and the Economic Research Service using Baseline Projections and economic models.
While there is an element of predictive forecasting to the Baseline Projections, they are largely used for budgetary purposes beyond the scope of today’s reports. “The projections are based on specific assumptions about macroeconomic conditions, policy, weather, and international developments, with no domestic or external shocks to global agricultural markets,” states USDA’s Office of the Chief Economist.
But anyone alive over the past five years knows that domestic and external shocks have become more commonplace in the ag commodity space. And that makes these baseline predictions more difficult to rely on throughout the year, which is why these estimates should be taken with a grain of salt.
So while the figures may cause some market volatility this morning, it is important to remember that those figures are not set in stone and may not fully represent a reliable estimate of 2023 acreage. And as we saw last year (Russia invaded Ukraine hours before the USDA outlook forum last year), market conditions can change dramatically in the time between the forum and the March 31 report.
Learn more about the context behind these acreage, production and usage projections: USDA Chief Economist reassures farm profits amid lower price forecasts
You May Also Like
Enter a zip code to see the weather conditions for a different location.


