Independence Day fireworks came to the grain market a few days early as the grain complex exploded higher in reaction to the USDA quarterly grain stocks and acreage report numbers. The numbers on face value were not all shocking, but when you plug them into a supply/demand balance sheet, it clarifies how tight the supply situation is.
As for the stocks numbers, they were pretty close to the trade’s line of thinking for once. Soybean stocks of June 1st were 766.8 million bushels. This was below the average estimate of 773 mb but within the range of trade estimates of 691 mb and 838 mb. Corn stocks as of June 1st were at 4.112 billion bushels. This was below the average estimate of 4.130 bb but within the trading range of 3.92 bb and 4.65 bb.
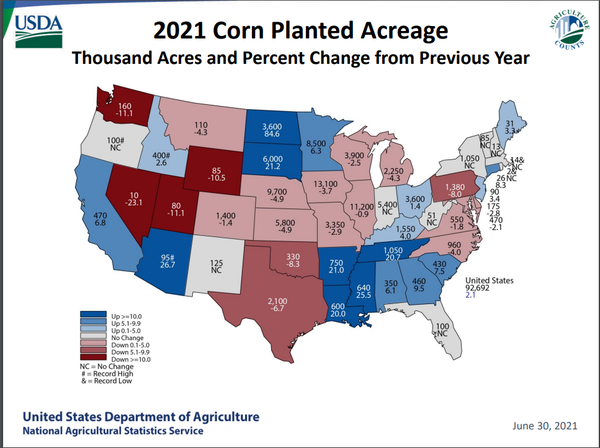
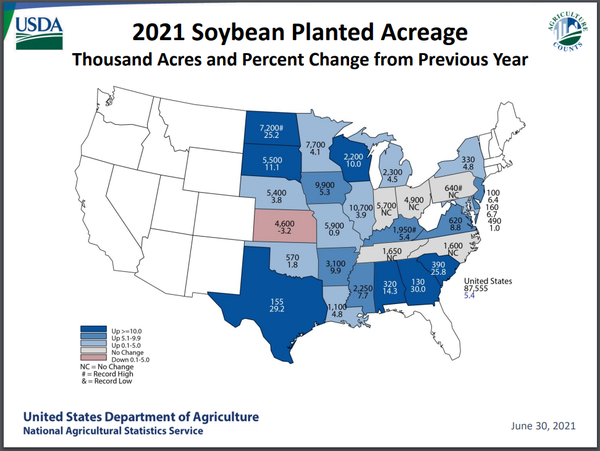
As for the acreage numbers, both soybean and corn acres were below the average trade guess and way below what some in the trade were thinking. Soybean acreage came in at 87.6 million acres, below the average estimate of 89.1 mb, while corn acreage came in at 94.692, below the trade average estimate of 93.8 million acres.
Now that the trade knows that a massive increase of acres and an unexpected increase in old-crop supplies didn’t materialize to alleviate our tight situation, all eyes are drawn to where this year’s national yield will end up. For corn, the USDA working trend yield is 179.5 b/a which is 2.9 b/a above the record national yield of 176.45 b/a.
We think that reaching trend yield will be an almost impossible feat.
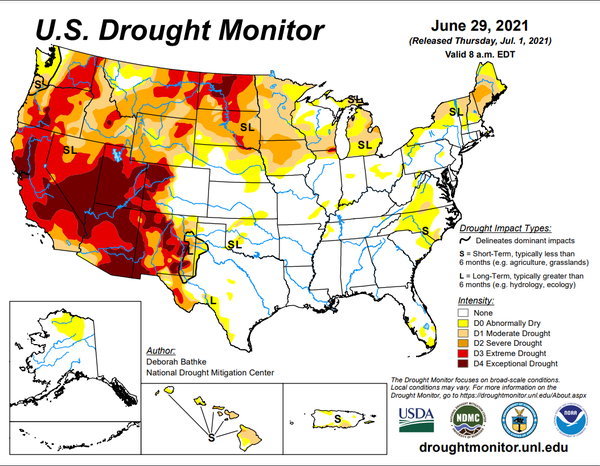
The bulk of additional acres above last year’s plantings were in areas of the country experiencing severe drought conditions, which will pull the national yield lower. If this happens, we believe the market will have to make another leg higher as the market tries to ration demand in an increasingly inelastic market.
The USDA is using a national soybean yield of 50.8, which would be the second highest on record if it came to fruition. Still, like corn, we saw a significant increase in planting where the drought is raging, making trend-line soybean yields very optimistic as well.


The USDA is currently projecting corn demand at 14,765 bb; we think it is too low, but more on that later. The question is, what type of yield do we need to achieve to meet this demand? Using the USDA harvest average of 84,495 (1,000 acres) times the USDA trend yield (179.5) would put the national production at 15,166 bb and add 401 mb to ending stocks. As I stated earlier, trend yield seems very unlikely. Harvest acres times the previous record national yield would only add 157 mb to ending stocks. A yield of 174 b/a would lower ending stocks by 63 million bushels, putting them at 1,039 mb while dropping the stocks to use number to 7%. To put a 174 national yield into a different perspective, if achieved, it would be two bushels better than last year’s national average.
When running the exercise above, I used the USDA’s estimated demand number to keep it consistent, but we believe that the export demand number is as much as 300 mb too low. If we are correct, it will take 178.3 b/a national yield to meet our projected demand; otherwise, the market will have to move higher to ration demand. That being said, we do not believe the USDA will come close to our demand number until early winter or possibly spring. Why are we bullish on demand? At this time last year, we had commitments for 19/20 corn exports to China of 1.33Mt with new crop sales for 20/21 at 819k tons. Fast forward one year, and we have commitments out of the US of 23.4Mt for old crop 20/21 and 10.74 Mt on the books for new crop already to China. Our commercial partners at JSA feel China will take at least the same amount of corn next year as this year and likely more, so the 300 mb number may still be too low.
The USDA put soybean planted acres at 87,555 and harvested acres at 86,720. If we take the harvested acres and multiply them by the USDA trend yield (50.8), we end up with a production of 4,405 bb. This is 15 mb below the USDA’s project demand of 4420 bb. If the US ends up with a national yield of 50.3 b/a, production falls short of their demand estimate by 59 mb. A national yield of 49.8 would mean ending stocks would fall to 69 mb leaving stocks to use at 1.6%.
After the volatility the market has experienced the past month, it feels like we should be through the “weather market,” but we are only about to enter it. With this week’s reports doing nothing to relieve the supply situation, it will come down to yield to meet the anticipated demand. With projected supplies at razor-thin levels, even if we manage to hit trend yields, any hint that the crop is coming up short could cause an explosive move to the upside and test all-time highs.
As always, feel free to contact me directly at 815-665-0461 or anyone on the AgMarket.Net team at 844-4AGMRKT. We’re here to help.
The risk of loss in trading futures and/or options is substantial and each investor and/or trader must consider whether this is a suitable investment. AgMarket.Net is the Farm Division of John Stewart and Associates (JSA) based out of St Joe, MO and all futures and options trades are cleared through ADMIS in Chicago IL. This material has been prepared by an agent of JSA or a third party and is, or is in the nature of, a solicitation. By accepting this communication, you agree that you are an experienced user of the futures markets, capable of making independent trading decisions, and agree that you are not, and will not, rely solely on this communication in making trading decisions. Past performance, whether actual or indicated by simulated historical tests of strategies, is not indicative of future results. Trading infromation and advice is based on information taken from 3rd party sources that are believed to be reliable. We do not guarantee that such information is accurate or complete and it should not be relied upon as such. Trading advice reflects our good faith judgment at a specific time and is subject to change without notice. There is no guarantee that the advice we give will result in profitable trades. The services provided by JSA may not be available in all jurisdictions. It is possible that the country in which you are a resident prohibits us from opening and maintaining an account for you.
The opinions of the author are not necessarily those of Farm Futures or Farm Progress.
About the Author(s)
You May Also Like


