December 30, 2016

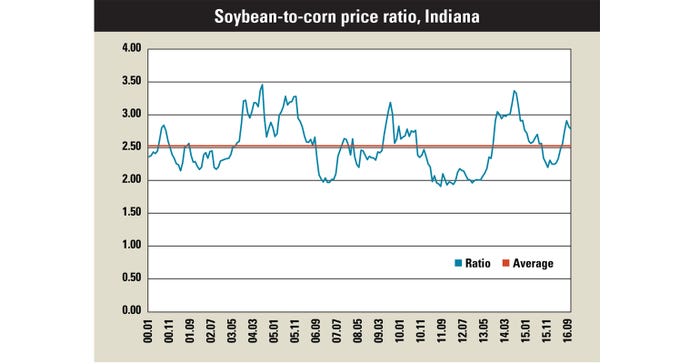
Using Indiana cash prices reported by USDA's National Agricultural Statistics Service, the average soybean-to-corn price ratio since January 2000 is 2.53. Recently, this ratio has been substantially higher than its long-term average. Specifically, during the last six months of 2016, the soybean-to-corn price ratio ranged from 2.75 to 3.00.
How common or uncommon is it for this ratio to be this high? Let's answer this question by examining historical trends in the soybean-to-corn price ratio since 2000.
What trends show
As indicated earlier, the long-run soybean-to-corn price ratio for Indiana is 2.53. The standard deviation, a measure of dispersion or variation from the average, for this ratio is 0.37. In approximately 17% of the months since January 2000, the soybean-to-corn price ratio has been less than its average minus the standard deviation. That means it has been less that 2.16.
Conversely, in approximately 20% of the months since January 2000, the soybean-to-corn price ratio has been greater than its average plus the standard deviation. That means it has been above 2.90 during those months.
The lowest soybean-to-corn price ratio since January 2000, 1.91, occurred in August 2011. The ratio was below 2.00 in December 2006; February and March 2007; April, June, July, August, November and December 2011; and January, February, March, November and December 2012.
The highest soybean-to-corn price ratio since January 2000, 3.46, occurred in July 2004. The ratio was above 2.90, which is the average plus one standard deviation, from October 2003 to August 2004; from March 2005 to January 2006; from July 2009 to September 2009; from October 2013 to November 2014; and in August 2016.

Put current ratio in perspective
The average ratio since January 2000 is 2.53. The soybean-to-corn price ratio has been relatively high, ranging from 2.75 to 3.00, since July 2016.
However, as indicated with the reports above, it’s not that uncommon for the soybean-to-corn price ratio to be this high. It’s certainly happened many times before.
Langemeier is assistant director of the Purdue University Center for Commercial Agriculture. He writes from West Lafayette.
About the Author(s)
You May Also Like


