Traders have plenty of ideas about the size of 2020 crops USDA will report Aug. 12. But one thing seems likely based on the known facts so far: Yields for both corn and soybeans should come in above normal.
Weather models, Vegetation Health Index readings, and the government’s own weekly crop ratings all point to the same conclusion reported this week by Farm Futures’ survey. There’s little indication of trouble overall, which should lead to ample supplies unless the end of the growing season takes a dramatic turn for the worse.
USDA next week releases its first estimate of 2020 production based on surveys of farmers, though collection of infield evidence won’t begin until next month. Up until now, the government used a corn yield of 178.5 bushels per acre. Typically this yield incorporates the statistical “trend” yield, which projects past results into the future, modified by good planting progress, lack of stress in June and the assumption of average growing season weather.
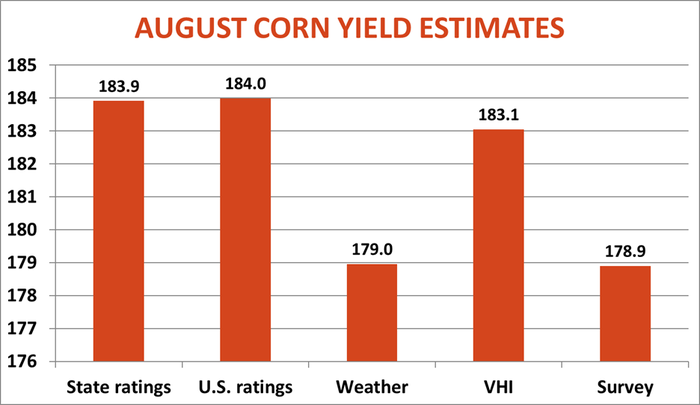
The 20-year trend yield for corn is 174.6 bushels per acre. July temperatures are the key weather variable for estimating corn yields; the month was a little warmer and drier than average in eight major producing states I track. But both readings weren’t extreme enough to offset fast planting progress. As a result, the weather model for corn puts the nationwide yield at 179 bpa.
This number comes in an asterisk. It’s based on initial weather date for July. Preliminary estimates on average monthly temperature and precipitation be published until next week, and these are typically revised later. But the 179 number is important because it’s little different from the 178.9 bpa reported by Farm Futures. Since 2007 the Farm Futures survey has been the most accurate way to forecast USDA’s August yields, accounting for 95% of the variance in the estimates. This R-squared as it’s known, is 85% for the weather model. But when all is said and done, the weather model is actually the best way of predicting what USDA will finally report in its final monthly estimate come January.
Both the weather model and survey are below some of the estimates in the trade currently, mostly due to strong weekly crop ratings. I generate estimates based on USDA’s national rating, and also make an adjustment for the various states reported weekly, weighted by their June acreage. These estimates are close: 183.9 for the state model and 184 bpa for the national method. The R-squared for these models is 92% and 94% respectively.
My final yield estimates come from Vegetation Health Index maps produced by satellites. These suggest a corn yield of 183.1 bpa and their R-squared is 85%.
Factor all these methods together, and the estimated yield comes in at 181.2 bpa. That would produce a 15.2 billion bushel crop if USDA’s assumptions about acreage hold up.
Soybean yield predictions
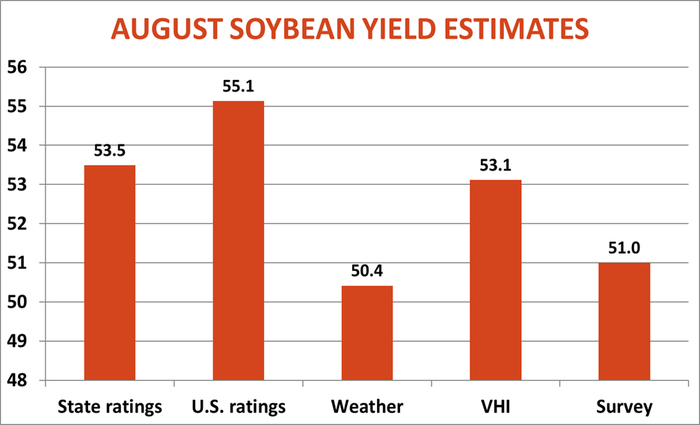
Projections for soybean yields are even more disparate, in part because August weather can be crucial. The “normal” yield used by USDA up until now is 49.8 bpa, though I put the 20-year trend yield at 50.3. The Farm Futures survey was a little higher still at 51 bpa.
Historically, the weather model for soybeans has been the best predictor of yields. This year it points to a yield of 50.4 bpa, but that assumes the mostly average weather forecast for August by the National Weather Service.
Other methods are more optimistic. Strong national weekly crop condition ratings translate to a yield of 55.1 bpa if they hold. The state-by-state rankings so far put the yield at 53.5, while the VHI for soybeans is at 53.1 bpa. Mashing up all the factors comes up with a yield of 52.1 bpa.
USDA will settle the debate Aug. 12, at least for a little while. Traders know these August estimates are only a start. Bulls will look for any scraps they can to argue a bottom is in. Bears, on the other hand, will say “big crops get bigger.”
But supply is only part of the story this year. What happens to demand in the months ahead may be just as important to determining hopes for rallies.


Knorr writes from Chicago, Ill. Email him at [email protected]
The opinions of the author are not necessarily those of Farm Futures or Farm Progress.
About the Author(s)
You May Also Like


