Subscribe to receive top agriculture news
Be informed daily with these free e-newsletters

Winning a plot test can be more luck than genetics.
October 21, 2016

Yield results are in and every plot or trial has an overall winner! Winning a plot isn’t easy. Sometimes, luck is involved. Years ago, one of our customers measured the impact of “shading” in a plot. If your company’s hybrid was placed next to taller hybrids, how much did being shaded by a taller hybrid affect yield in the outside rows that were shaded? They found the difference could range from 7.7 to 33 bu/acre penalty from being shaded! In some company’s trial protocols, they discard the outside two rows and only count the results from the inside two rows.
Consistently winning is so difficult that companies frequently report percentage wins. Hybrid ABC won 83% of head-to-head trials vs. Hybrid XYZ. It’s hard to blame seed salespeople for using plot results to sell seed, but that frequently results in promoting the plot winners when they may not be the best fit for your fields.
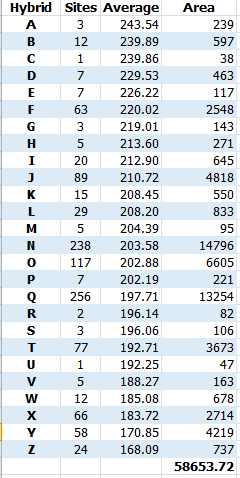
When using plot data to select hybrids and varieties, the fact that there is only one winner does not mean you scrap other genetics from your line-up. Big data analytics, like those used by Premier Crop, has been referred to as a way of “crowd sourcing” hybrid and variety selection. Same as with plot results, it’s important to look deeper than what hybrid or variety appears to have “won”. This chart is an example of real results of a local data pool – with hybrid identity masked with a letter. In the table, the number of “sites” is the number of unique farm fields and the area column is acres.
Which of these is the best number to plant? Hybrid A is impressive, averaging over 240 bu/acre on three different fields. In order to average 243 bu/acre, there must have been many times the yield monitor was reading over 260 or 270 bu/acre. But I instantly gravitate to Hybrid B – not that much different in yield, but results occurred on twice the acres and on four times more fields!
What do you think of Hybrid F? Many more sites and acres listed, but over 25 bushel per acre less yield.
Hybrid and variety results that are calculated over more acres always show up down the list. Why? It’s not because they aren’t great performers. It’s because they get placed in more diverse and negative growing environments. There are a lot of plot winners that don’t shine when they gain market share. In reality, not all of your fields match the well-drained, high-fertility areas that make for ideal plot location.
The more you can sort results to match your fields and management practices, the better your own experience with specific hybrids and varieties will be. The reality is there is no right way to analyze results, but it is important to examine the data results beyond yield. Number of acres and fields data help you understand why hybrid and variety yields vary. It easier for a hybrid to look either phenomenal or horrible if it is only on a few fields. Conversely, if a variety can stay in the top third as it gains significant market share, it’s likely one of the real winners!
You May Also Like
Enter a zip code to see the weather conditions for a different location.


