October 29, 2020

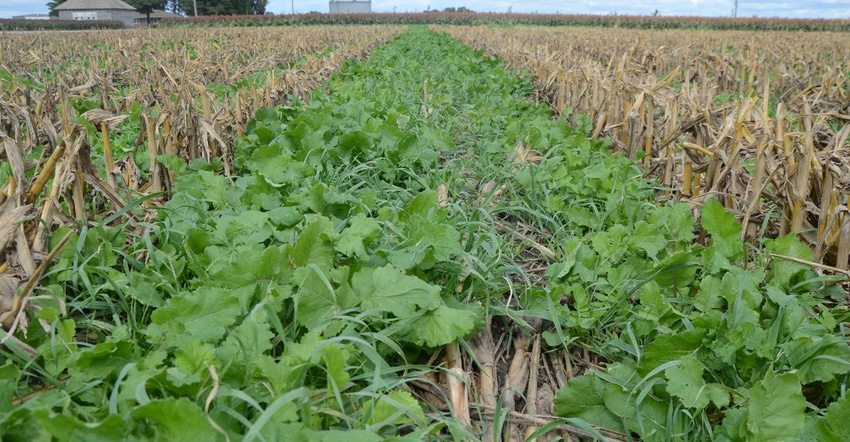
Cover crops are an increasingly used cropping practice, not only by Nebraska farmers, but also across the Midwest and South. Using cover crops is an agronomic practice that has financial impacts, which can be estimated by farmers before use or calculated after implementation. This article will review research to build an understanding of financial analysis methods to cover crop use.
Three reported reasons for cover crop use are for reduction of nitrate pollution, reduction of soil erosion and increasing soil organic matter. Other benefits of cover crops may include grazing or forage and cost-share payments.
Cover crop use increased from 2012 to 2017 across the U.S. Nebraska use increased from 1.3% in 2012 to 3% in 2017, according to statistics from the 2017 Census of Agriculture. Nebraska farmers planted 3.4% of cropland to cover crops.
A general trend of cover crop use in the U.S. is a decline as one moves west. Farmer concerns in the western half of the U.S. appear to be moisture use by the cover crop with a loss of crop yield and establishment around harvest time.
Two approaches have been taken in research to analyze the financial impact of cover crops. One approach has been to build simulations, based on agronomic research, that each cover crop adopter can use to develop a personal cost-benefit analysis.
Another approach has been to use focus groups to calculate realized net returns to cover crop use. One resource that has been used by researchers to tailor their research is the USDA Agricultural Resource Management Survey.
A 2020 study in the Upper Midwest used a focus group approach with Minnesota, Illinois and Iowa farmers to develop a pilot partial budget analysis of financial returns to cover crop practices. This differed from previous field-level experiment analyses by gathering farm-level financial data.
Farmers in the focus group provided cropping financial data, along with agronomic data, with and without cover crops. The data was then entered into the Natural Resources Conservation Service cover crop partial budget tool for analysis. Farmers in the focus group also were asked questions to elicit their reasons for incorporating cover crops into their farm management.
The two most frequent reasons were to abate soil erosion and improve soil health. Farmers averaged 9.33 years of cover crop use with a range of four to 33 years, with 460 acres average planted to cover crops in 2014. Cover crops were terminated with herbicide by 13 of 15 in the focus group.
Partial budgets are used to discern the net revenue gain or loss from a change to a farming practice.
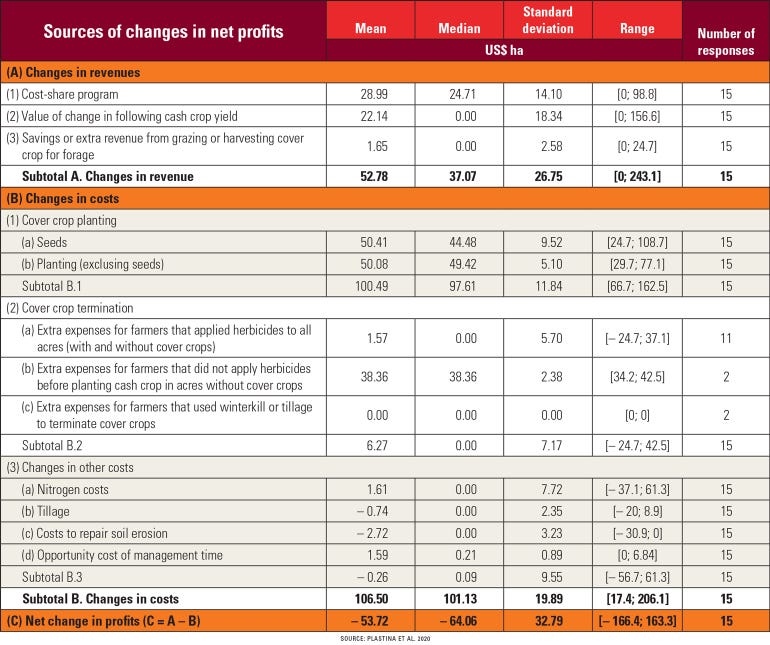
The 2020 study in the Upper Midwest used the NRCS partial budget tool to calculate changes to net revenue. Cover crops reduce soil erosion and nitrogen loss, and the NRCS partial budget can calculate the value if the user enters the reduction in soil erosion.
Table 1 presents the results of the calculations for the focus group participants. Note that the calculations are in hectares. One hectare is 2.47 acres. The wide range of net returns (-$166.40 to 163.30) and large standard deviation indicate that net revenue may be sensitive to individual management practices.

Another method to analyze cover crop financial performance is to calculate breakeven to cover crop adoption. This analysis uses all the costs to cover crop adoption and then calculates the amount of reduction to other costs necessary to break even.
For instance, if a farmer plants a leguminous cover crop to provide nitrogen for the next year’s crop, the cost of the cover crop would equal the reduction in purchased nitrogen.
Assume that the cover crop will cost $40 per acre to establish. If nitrogen cost is 35 cents per pound, then the cover crop would need to provide at least 114 pounds ($40 ÷ $0.35) of nitrogen for the next year’s corn crop to break even.
A second source of revenue may be grazing or harvesting forage. Cover crop grazing mix establishment costs $47.50, which includes all seed, machinery and herbicide costs, using numbers from 2020 University of Nebraska Crop Budgets.
Recent USDA price reports for fair-to-good quality alfalfa were $80 per ton. Reducing purchased forage by 0.59 tons per acre of cover crop (47.50 ÷ $80) will be breakeven. A third source of increased income from cover crops could be reduced weed pressure or reduced herbicide costs. This cost reduction would be on an individual farm or field basis, but would follow the same process as the two breakeven examples above.
The analysis methods discussed and demonstrated above are short-term analyses of readily quantifiable aspects of the use of cover crops. Agronomic research in regions where adequate rainfall occurs for full yield expression shows that no reduction in yield occurs for a maize cropping system.
Other research shows that economic impacts vary by latitude, approximately north of U.S. Highway 30. Cover crops in this region saw reduced losses, while regions south of the highway showed positive net income from cover crops. Grazing and cost share for cover crop establishment were the two components critical to the realization of positive net income.
Tigner is a Nebraska Extension agricultural systems economist.
You May Also Like


