The last time I wrote an article for Farm Futures was Sept. 15th titled “Why China Needs More Corn.” In that article we reviewed potential Chinese corn demand that at the time was poised to come to the U.S. due to a host of factors.
Thus far that corn and soybean demand has been amazingly strong. Here are the important questions we now need to answer:
What are the potential impacts to the forecasted carry outs, U.S. stocks-to-use ratios, and what does that eventually mean for potential prices?”
As I have stated several times throughout my career, price prediction is impossible and futile. It’s usually a waste of energy, emotion, and time. Focus instead on price protection as the only methodology and ideology one should utilize when implementing a strategy. If done properly, risk can be reduced, bushel values can be defended, and flexibility maintained in any market, particularly one that may accomplish amazing things when transitioning from supply-driven to a demand-driven market.
In terms of exports, a sold bushel and an inspected bushel are two very different things. Sales can be cancelled and or switched out from U.S. origin, and until that bushel is loaded (inspected) and shipped off, there is always the threat of cancellation or switching of origin to another nation.
How will weather impact South American production?
South American soybean and corn crop progress will be watched closely by the trade. Brazil is experiencing a La Nina event that may reduce production. Weather forced late plantings in South America’s primary soybean crop, that may have implications later for both Soybean and the safrinha corn crop. Delays or reduced production would likely keep China in the U.S. market longer than normal, and for possibly more bushels than currently considered if shortfalls are eventually proven.
Is the Ukraine corn crop coming up short?
The other main competitor to the U.S. in corn is Ukraine. Many suggest that Ukraine’s corn production numbers are currently falling and with potential increases of Chinese import quotas, this sets the stage for some very “interesting” potentials going into the winter, spring, and summer months -- meaning U.S. corn and soybean balance sheets could continue to tighten beyond today’s considerations.
What are the potential changes in the U.S. balance sheet?
Pay close attention to recent history regarding prices relevant to the stocks-to-use ratios. Each week we evaluate all the factors that influence production, consumption, exports etc. Each week all data is continually re-evaluated.
The next USDA WASDE Report is to be posted on Nov. 10th, one week after the U.S. Presidential Election. There will be continued volatility moving forward as the nation votes for its leadership and what that may mean for its trade agreement with China.
The current forecasted balance sheets for corn and soybeans are provided by the Advance Trading Inc. (ATI) Research Department. These are forecasts; note that these numbers might not be shown or realized by the USDA on the next WASDE Report, but rather as potential over time.
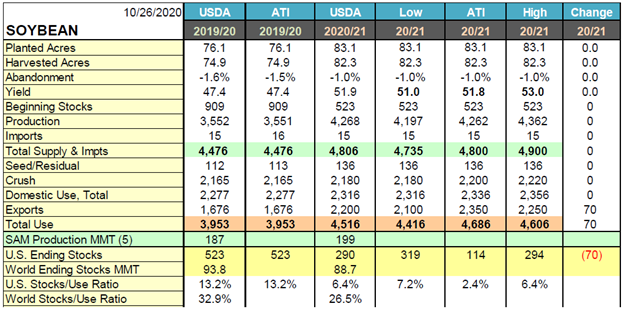
In the current soybean supply-demand update, this week’s ending stocks are 70 mbu smaller, based on slow pace of Brazilian planting that could defer the start of harvest and boost exports from the U.S. during the Jan- Feb period.
This leaves 2020/2021 carry-out at 114 Million Bushels (2.4% stocks-to-use ratio) versus the USDA’s 290/6.4% October estimate.
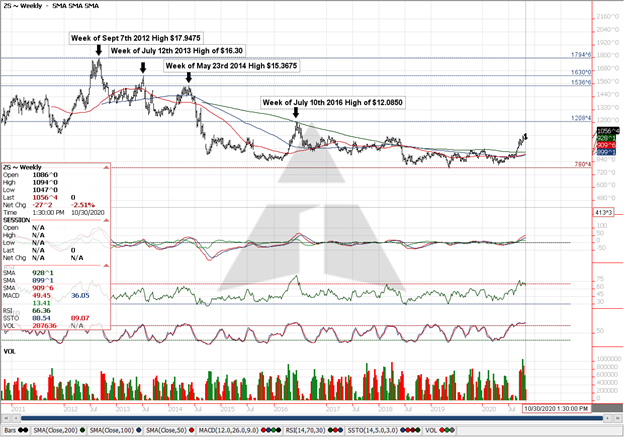
Below are the previous carry outs, stocks-to-use ratios and the date of the WASDE Release and what eventually unfolded relative to price in soybeans in the past going back to 2011 on a weekly soybean chart. Keep in mind that no two years are the same; that is not predicting that prices will replicate past performance of said market. However, I believe one must have a proper relative understanding of what has happened in the past to respect future potentials.

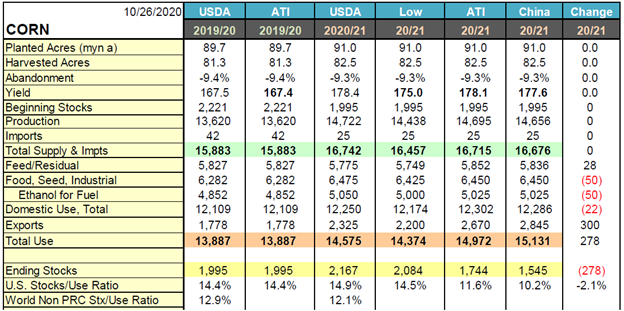
In corn, current supply/demand updates show carry out reduced 278 to 1.744 billion, with a Chinese Potential to further lower that number to 1.545 Billion.
Exports were increased 300 mbu based on a downward revision in the Ukraine crop to 30 MMT and expectations for a slow start to next summer’s safrinha harvest. Feed/residual use increased 28 to 5.852 based on a revision in GCAU’s while ethanol grind was reduced 50 as the industry grind continues to underperform.
The New Stocks/Use Ratio dropped from 13.8% to 11.6%
Below are the Previous carryouts, stocks-to-use ratios and the date of the WASDE Release, and what eventually unfolded relative to price in corn in the past going back to 2011 on a weekly corn chart.

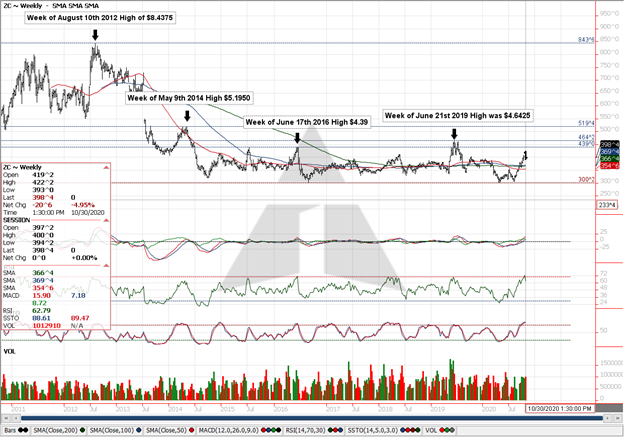
For both soybeans and corn the potential prices that are correlated with current forecasted carry outs and stocks-to-use ratios need to be observed and respected. These are not predictions, but rather observations. I often tell customers that “Charts do not tell one where the market is going, but only where it has been.” I firmly believe that to be true, however, one must also respect history and be prepared for what may come if our U.S. balance sheets continue to shrink in supply over the next several months.
Advance Trading
Contact ATI at
800-664-2321
The risk of trading futures and options can be substantial. All information, publications, and material used and distributed by Advance Trading Inc. shall be construed as a solicitation. ATI does not maintain an independent research department as defined in CFTC Regulation 1.71. Information obtained from third-party sources is believed to be reliable, but its accuracy is not guaranteed by Advance Trading Inc. Past performance is not necessarily indicative of future results.
The opinions of the author are not necessarily those of Farm Futures or Farm Progress.
About the Author(s)
You May Also Like


