
Subscribe to receive top agriculture news
Be informed daily with these free e-newsletters
Article Outline
President Trump – Market Catalyst
Near Term Market Considerations Week Beginning February 6, 2017
Markets Continue Absorbing Global Government and Central Bank Leadership
S. Federal Reserve Bank Intervention
Rising Interest Rate Environment
Federal Reserve Issues FOMC Statement
Global Economic Upturn Underway, Near Term Positive for Global Equity and Commodity Market
Commodity ETFs One Month Percent Change
Select U.S. Market ETFs One Month Percent Change
Select U.S. Market ETFs One Month Percent Change
Market-by-Market: Near Term Market Considerations Week Beginning February 6, 2017. To see the charts, visit http://www.deltafarmpress.com/marketing/market-price-considerations-week-feb-6-2017.
President Trump – Market Catalyst
Near term President Donald Trump is fulfilling his reflation leadership role as a catalyst for building economic and market activity along with Congress and the Central Bank.
With each passing week the overall “Market Euphoria” will become increasingly focused on fundamental, social and political realities.
Understanding the larger macro market moving realities we’ll discuss as events unfold.
Weekly Market Considerations Chart Show: The reason for adding the weekly market considerations chart show is to allow readers to easily visualize and follow an array of domestic and global market activity.
NearTerm Market Considerations Week Beginning February 6, 2017
Near Term Summary Considerations:
10-Year US Treasury Yield: Neutral, potentially a little bullish or a lower yield
US Dollar Index: Near term dollar weakness likely or simply sideways consolidation for a period
CRB Index: Global macro forces supportive and slowly building inflationary support emerging
$WTIC Light Crude Oil: Geo-economic and geopolitical issues seem to dominate price action. Technically this market appears in search of higher highs, fundamentals suggest some corrective price action should be anticipated
Soybeans: Soybeans prices either rebound early this week or additional price weakness will have to be defined.
Corn: Consolidating, market acts more bullish than bearish, but needs to close above $3.69
Rice: Price weakness remains defined in part by global economic, political, and social uncertainties. Overplanting in 2017 given present fundamentals would provide added market challenges
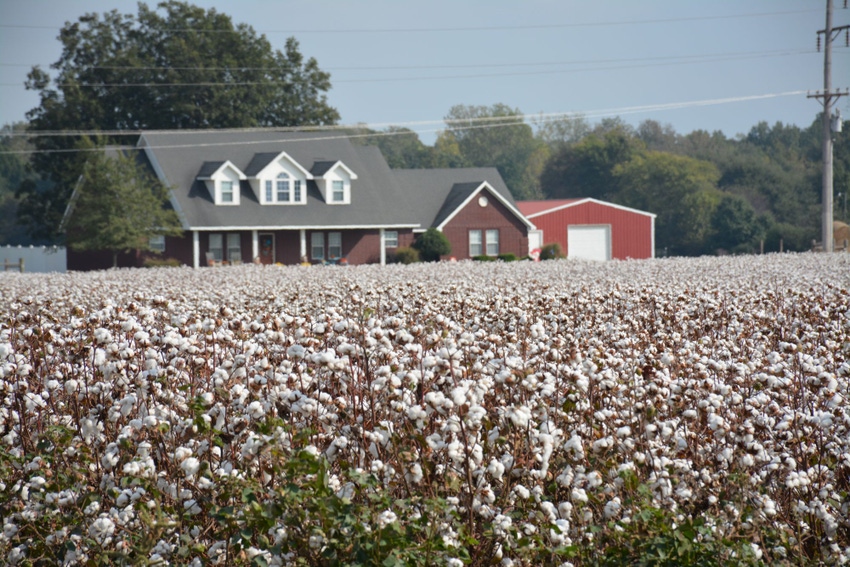
Cotton: Bullish prices likely into the 84-cent area. Near term if prices fall below 68-cents, then likely corrective price activity underway
Wheat: Consolidating, needs to close and hold above $4.40 to maintain any upward momentum
SPY SPDR S&P 500 ETF: Trend remains positive, prices need to correct or consolidate some of their gains
QQQ NASDAQ Power Shares: Another good week, corrective price action needed, but not required
EFA iShares ETF - Global Equities Excluding U.S. and Canada: Building momentum
EEM iShares ETF, Emerging Market Equities: Range bound – Potentially bullish even though momentum slowed the week of January 30, 2017, important week ahead
MCHI iShares ETF - China Equities Available International Investors: Potentially bullish, political friction should not be overlooked, price action very important at this point
Markets Continue Absorbing Global Government and Central Bank Leadership
For the most part domestic and global equity and commodity market participants remain focused on positives associated with U.S. Presidential, Congressional, and Central Bank and global counterpart intervention activities of ongoing and anticipated building aggressive stimulative reflation activities through Fiscal Policy and transitioning away from Central Bank monetary accommodation to managing economic activity in a rising interest rate environment.
S. Federal Reserve Bank Intervention: The big potentially market moving story the week of Jan. 30 did not surround presidential and congressional stimulative actions, since most market participants believe at least near term they have a reasonable handle on those expectations.
But rather market participant anxiety focused on the U.S. Federal Reserve guidance Feb. 1 following their Federal Open Market Committee (FOMC) Meeting.
The Fed’s FOMC statement actually remained near term conservative or accommodative even though their verbal guidance was hawkish, implying at least for the next one to two years, highly advising all to plan to manage their economic activity in an elevated interest rate environment.
Rising Interest Rate Environment: A rising interest rate environment would be for example the 10-year Treasury yield was 1.37 in July 2016, and rose to 2.60 in December 2016, presently on Feb. 3, closed at 2.49.
The bond market has been in a 35-year bull market or falling yields. Some suggest the bond bull market will be over when the 10-year yield exceeds and stays above 2.60, others say a yield of 3.00 and others even suggest higher.
Reality is we could move sideways for a number of years in a range probably not higher than 3 to 4 for the next 1 to 2 years and with the next recession the possibility of retesting the previous low or even lower, will be defined by domestic and global fiscal and monetary policy remaining a possibility.
The Fed in their FOMC statement said. “In view of realized and expected labor market conditions and inflation, the Committee decided to maintain the target range for the federal funds rate at 1/2 to 3/4 percent. The stance of monetary policy remains accommodative, thereby supporting some further strengthening in labor market conditions and a return to 2 percent inflation.”
Click on the following link to see the full statement.
If the Fed had chosen to raise the rate then most likely the dollar and interest rates would have found lift, which likely would have been negative for many global currencies and commodities in general given current global economic conditions.
The Fed presently appears to be leaning toward a federal funds rate increase in June with plans for only 2 rate hikes this year. That said we could still see some additional strength in the 10-year Treasury if the Fed decides to start reducing their balance sheet.
Global Economic Upturn Underway
Near Term Positive for Global Equity and Commodity Markets
Presently, the ongoing and accelerating “Orchestrated Global Economic-Upturn” is underway and achieving desired results, which can be seen by the following U.S. and Global equity and commodity markets.
The following is a select list of United States, International and Commodity ETFs and their respective market activity over the past month, which in turn reflects domestic and global building or declining momentum.
Commodity ETFs One Month Percent Change |
Symbol |
Change |
LD |
LIT |
DBB |
SLV |
JJU |
PPLT |
BAL |
JO |
JJC |
DBP |
PALL |
GLD |
WEAT |
JJG |
JJN |
SGG |
DBA |
SOYB |
COW |
CORN |
DJP |
GSP |
DBC |
BNO |
USO |
USL |
DBE |
NIB |
UGA |
UNG |
GAZ |
|
|
Select U.S. Market ETFs One Month Percent Change |
Symbol |
Change |
QQEW |
QQQ |
IWR |
MDY |
IWB |
ITOT |
IWV |
RSP |
SPY |
OEF |
DIA |
IWM |
IJR |
IWC |
International ETFs One Month Percent Change |
Symbol |
Change |
BRF |
SCIF |
FM |
TUR |
EPOL |
CQQQ |
ENZL |
EWZ |
EWY |
EWS |
KWEB |
ILF |
FRN |
EPI |
PIN |
ECH |
GULF |
INDA |
AAXJ |
EDIV |
EPU |
EWD |
EDD |
IEMG |
MCHI |
EWT |
EEM |
CHIQ |
EPHE |
HAO |
EWH |
NORW |
VWO |
THD |
EWO |
TAO |
EWW |
GXG |
EZA |
EWM |
EWA |
SCZ |
IXUS |
EMLC |
EWG |
VEU |
FXI |
EWL |
GAF |
EWN |
ASHR |
EWC |
EWJ |
IEFA |
EFA |
DWX |
EWP |
EUFN |
IDV |
VNM |
ALD |
HEEM |
EZU |
PCY |
PCY |
EIS |
EIDO |
EWK |
HYEM |
CHIX |
EMB |
SDIV |
EWQ |
EWU |
HEWG |
RSX |
HEFA |
ERUS |
DXJ |
DBEF |
HEDJ |
HEZU |
HEWJ |
BNDX |
EWI |
EGPT |
NGE |
GREK |
Market-by-Market: Near Term Market Considerations Week Beginning February 6, 2017
Charts 1 - 3. $UST10Y - 10-Year US Treasury Yield
Primary Consideration:
Neutral: the 10-Year Treasury Yield potentially bullish with a lower yield potential
This is a market that likely builds a trading range for the next one to two years with the Federal Reserve defining potential upside with a potential top at 3 to 4
We simply need to allow chart activity to provide guidance
Present market structure suggests financial institutions and borrowers are winners at these levels
Some suggest the 35 year bull bond market will be over with a yield that holds above 2.6, others at 3.0; Actually, global fiscal and policy market intervention may make picking these points premature
This is a market that could simply move sideways for a few years and even revisit the previous low or make a new low
Charts 4 - 6. Power Shares US Dollar Index
Primary Considerations:
Neutral - The following determines sideways consolidation for a period or a resumption of the Dollar’s move to the upside:
2017 European Union management/mismanagement a key factor in dollar strength or weakness in year ahead
Bigger Picture: Global interventionist government and Central Bank activities will define dollar strength or weakness over the next 3 to 12 months, including President Trump’s currency and trade policy objectives
Chart 7. EURO
Potentially bullish near term
Chart 8. Australian Dollar
Near term building momentum
Chart 9. Canadian Dollar
Potential near term strength
Chart 10. Japanese Yen
Increasingly likely near term strength
Chart 11. British Pound
Possible corrective price action before heading lower
Chart 12. Dow Jones
Trend remains up
Chart 13. Dow Transports
Trend remains up
Chart 14. S&P 500 Large
Trend remains up
Chart 15. NASDAQ Composite
Trend remains up
Chart 16. World Equity less U.S. & Canada
Positive momentum appears to be building
Chart 17. Emerging Markets
Momentum slowed, important week ahead
Chart 18. Australia
Positive momentum appears to be building
Chart 19. Brazil
Momentum appears to be slowing
Chart 20. Canada
Positive momentum appears to be building
Chart 21. China
This China equity remains neutral
Chart 22. Mexico
Possible bottom being formed
Chart 23. Japan
Positive momentum appears to be building
Chart 24. Russia
Price direction likely dependent on oil price firmness
Chart 25. India
India is presently dealing with a number of internal issues
Charts 26 - 28. CRB Index
Primary consideration:
The CRB Commodity Index appears to be building a base to move higher, which near term would be a primary function of oil price leadership and/or broad commodity support, reasonably stable to weaker dollar, and belief and confidence in the near term industry and global fiscal/monetary policy leadership.
Charts 29 - 31. $WTIC Light Crude Oil
Primary Consideration:
A challenging market being influenced by Geopolitical and Geo-economic issues
A market which appears in search of higher highs, corrective price action should be anticipated
2017 – Likely primary range $40 to $60 with possible high in $72 area
Washington Leadership likely bullish U.S. energy production
OPEC and other oil producers have major role in defining 2017 price structure
Global uncertainties supportive of prices
Charts 32 - 34. Soybeans
Primary Consideration:
Soybean prices either rebound early this week or additional price weakness will have to be defined
A near term price rebound, would make one revisit 2016 price action in March, April and May.
Remove reflationary activities and global uncertainties, given fundamentals then price weakness would likely be highly problematic
2017 – Pricing opportunities likely emerge as the year progresses
Additional Thought:
Market participants appear to be building a risk appetite. Being short means at least having close mental stops
Charts 35 – 37. Corn
Primary consideration:
Consolidating, but this market continues to act more bullish than bearish, closing and holding above $3.69 likely implies a move into the $4.15-plus
2017 – Pricing opportunities emerge as the year progresses in corn, soybeans, and wheat
Charts 38 - 39. Rice
Primary consideration:
Neutral – Price weakness remains defined in part by global economic, political and social uncertainties
Overplanting in 2017 without additional demand source could be highly problematic for 2017 marketing year prices
Charts 40 - 42. Cotton
Primary Consideration:
Bullish prices likely into the 84-cent area. Near term if prices fall below 68-cents, then likely corrective price activity underway
Charts 43 - 45. Wheat
Primary consideration:
Consolidating, needs to close and hold above $4.40 to maintain any upward momentum
Charts Book Index – Link
Chart 1. $UST10Y - 10-Year US Treasury Yield, Weekly Chart, 2014 – Feb. 3, 2017
Chart 2. $UST10Y - 10-Year US Treasury Yield, Daily Chart, May 2016 – Feb. 3, 2017
Chart 3. $UST10Y - 10-Year US Treasury Yield, Daily Chart, 2007 – Feb. 3, 2017
Chart 4. Power Shares US Dollar Index, Weekly Chart, 2014 – Feb. 3, 2017
Chart 5. Power Shares US Dollar Index, Daily Chart, July 2016 – Feb. 3, 2017
Chart 6. Power Shares US Dollar Index, Monthly Chart, August 2007 – Feb. 3, 2017
Chart 7. EURO Monthly Chart, 1997 – Feb. 3, 2017
Chart 8. Australian Dollar Monthly Chart, 1997 – Feb. 3, 2017
Chart 9. Canadian Dollar Monthly Chart, 1997 – Feb. 3, 2017
Chart 10. Japanese Yen Monthly Chart, 1997 – Feb. 3, 2017
Chart 11. British Pound Monthly Chart, 1997 – Feb. 3, 2017
Chart 12. Dow Jones, Monthly Chart, 1997 – Feb. 3, 2017
Chart 13. Dow Transports Monthly Chart, 1997 – Feb. 3, 2017
Chart 14. S&P 500 Large Caps Monthly Chart, 1997 – Feb. 3, 2017
Chart 15. Nasdaq Composite, Monthly Chart, 1997 – Feb. 3, 2017
Chart 16. World less U.S. & Canada Monthly Chart, 2001 – Feb. 3, 2017
Chart 17. Emerging Markets Monthly Chart, 1997 – Feb. 3, 2017
Chart 18. Australia Monthly Chart, 1997 – Feb. 3, 2017
Chart 19. Brazil Monthly Chart, 1997 – Feb. 3, 2017
Chart 20. Canada Monthly Chart, 1997 – Feb. 3, 2017
Chart 21. China Monthly Chart, 2004 – Feb. 3, 2017
Chart 22. Mexico Monthly Chart, 1997 – Feb. 3, 2017
Chart 23. Japan Monthly Chart, 1997 – Feb. 3, 2017
Chart 24. Russia Monthly Chart, 2007 – Feb. 3, 2017
Chart 25. India Monthly Chart, 2007 – Feb. 3, 2017
Chart 26. $CRB Reuters/Jefferies CRB Index, Weekly Chart, November 2013 – Feb. 3, 2017
Chart 27. $CRB Reuters/Jefferies CRB Index, Daily Chart, July 2016 – Feb. 3, 2017
Chart 28. $CRB Reuters/Jefferies CRB Index, Monthly Chart, 2007 – Feb. 3, 2017
Chart 29. $WTIC, Weekly Chart, 2014 – Feb. 3, 2017
Chart 30. $WTIC, Daily Chart, July 2016 – Feb. 3, 2017
Chart 31. $WTIC, Monthly Chart, 2007 – Feb. 3, 2017
Chart 32. Soybeans, Weekly Chart, 2014 – Feb. 3, 2017
Chart 33. Soybeans, Daily Chart, July 2016 – Feb. 3, 2017
Chart 34. Soybeans, Monthly Chart, 2004 – Feb. 3, 2017
Chart 35. Corn, Weekly Chart, 2014 – Feb. 3, 2017
Chart 36. Corn, Daily Chart, July 2016 –Feb. 3, 2017
Chart 37. Corn, Monthly Chart, 2007 – Feb. 3, 2017
Chart 38. Rough Rice Mar '17 (ZRF17) CBOT, Quarterly, Continuation Chart, 1987 – Feb. 3, 2017
Chart 39. Rough Rice Mar '17 (ZRF17) CBOT, Daily Chart, Feb. 2016 – Feb. 3, 2017
Chart 40. Cotton, Weekly Chart, 2014 – Feb. 3, 2017
Chart 41. Cotton, Daily Chart, July 2016 – Feb. 3, 2017
Chart 42. Cotton, Monthly Chart, 1997 – Feb. 3, 2017
Chart 43. Wheat, Weekly Chart, 2014 – Feb. 3, 2017
Chart 44. Wheat, Daily Chart, July 2016 – Feb. 3, 2017
Chart 45. Wheat, Monthly Chart, July 2016 – Feb. 3, 2017
Bobby Coats is a professor in the Department of Agricultural Economics and Agribusiness, Division of Agriculture, University of Arkansas System. E-mail: [email protected].
DISCLAIMER-FOR-EDUCATIONAL-PURPOSES
You May Also Like
Current Conditions for
48°F
Mostly Cloudy
Day 51º
Night 36º
Enter a zip code to see the weather conditions for a different location.


