


Subscribe to receive top agriculture news
Be informed daily with these free e-newsletters
The House Agriculture Committees and the Senate Committee on Agriculture Nutrition and Forestry have been writing a new farm bill that would replace the Agricultural Act of 2014, the farm bill that is scheduled to expire at the end of the 2018 fiscal year Sept. 30.
But what if Congress doesn’t pass a new law? Would the committees be able to pass an extension of the current law with one important change – allowing farmers to switch from Agricultural Risk Coverage to the Price Loss Coverage program?
That’s what Texas A&M University’s Agricultural and Food Policy Center is assuming in its “Baseline Outlook” for the cash flow and equity positions for the 100 or so U.S. representative farms it maintains to help Congress better understand the current state of U.S. agriculture and its supporting industries. (The Congressional Budget Office has adopted the same set of assumptions.)
James Richardson, co-director of the Agricultural and Food Policy Center with Joe Outlaw, discussed the latest Baseline Outlook from the AFPC and the University of Missouri’s Food and Agricultural Policy Research Institute or FAPRI during a webinar hosted by Bobby Coats, professor of agricultural economic and agribusiness with the University of Arkansas System Division of Agriculture. (http://bit.ly/2E2BEla)
Ag Situation Changed Since 2014
Richardson said the AFPC and FAPRI’s preliminary baseline projections were presented to Congress in December. The final projections will be presented in March. Although the outlook is slightly improved for some crops, the picture is significantly different than it was when the organizations were reporting their findings in 2013 and 2014 when the current farm bill was being written.
“We built a whole farm simulation model here in AFPC about 40 years ago, and we've been using it to advise farm policy for the House and Senate Ag Committee staffers since 1985,” he said. “The purpose of this outlook is to give us a projection of what farmers might look like over the next five years; 2016-2022 is our actual study period in this analysis.”
The AFPC defines conditions as good, marginal and poor, classifying these in green, yellow and red so it's easily understood graphically.
“We consider a farm in good financial position if it has less than a 25 percent chance of a negative ending cash balance and less than a 25 percent chance of losing real net worth,” he said. “A marginal farm is one that has a 25 percent to 50 percent chance of a cash flow deficit and losing real net worth, and a farm that is in poor financial condition is one that has more than a 50 percent chance of losing real net worth and having negative ending cash.”
63 Representative Farms
Each of the 63 representative crop farms and 35 dairy and beef cattle operations the AFPC maintains was updated in 2016 and 2017 in preparation for writing the 2018 farm bill.
Richardson cited a representative corn and soybean farm in Webster County, Iowa, as an example of the process the AFPC uses. “We asked the Extension agent in Webster County to pull together five or six producers who were of the typical size, full-time farmers, who were not taking a large income off the farm with off-farm employment. The first time we met with the panel was 1987. We updated that farm every two to three years since then.”
The outlook for the representative farms has changed substantially since the time of writing the 2014 farm bill. “Let's look back here in January of 2014,” Dr. Richard noted. “Things looked pretty rosy back then. We had 50 percent to 55 percent of our farms in the green category. By 2016, prices had fallen; PLC payments weren't large enough to make up the full difference, and we saw an increase in the red category to almost 50 percent of the farms.
“In January of 2017, we were forecasting 50 percent of our feed-grain farms as being in the red. This baseline – for December 2017 – is a little bit better. We have a little bit more of our farms in the green, less in the red.”
In its current baseline outlook, the AFPC has nine of its feed-grain farms in the green category, five in the marginal category and nine in the poor category.
“This is assuming a continuation of the farm bill and assuming that in 2018 the farms that were in ARC (Agricultural Risk Coverage) are able to switch over to PLC (Price Loss Coverage),” Dr. Richardson said. “We assumed, like the Congressional Budget Office, that even if the farm bill is continued, in 2018 farmers will have a re-election option allowing them to switch from ARC to PLC because it looks like PLC would be paying more over that future period.”
(Richardson did not refer to the lack of a cotton program in Title 1 of the farm bill. Some observers believe disaster legislation now pending in Congress could restore cotton or seed cotton to the Commodity title of the farm bill, making cotton growers eligible to participate in the PLC program.)
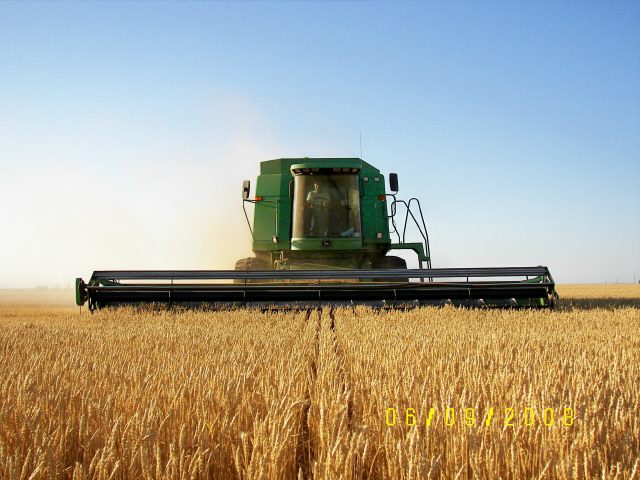
Changes in Wheat
The AFPC and FAPRI baseline includes several farms that derive more than 50 percent of their receipts from wheat. Back in 2014 the farms located in Kansas, Colorado, Montana, Washington and Oregon were mostly in the green. In the current baseline 75 percent of the farms are in the red category.
Given the current outlook and the reference price for wheat, quite a few of wheat farms would prefer to move to the PLC program after 2018 than to remain in the ARC program, Richardson said.
In cotton, farmers are enjoying a somewhat better outlook for the next five years. “It’s nothing like what we saw back here in 2011, but they are looking a little better than what we had in 2014 or 2013,” he said. “In terms of the baseline projection, comparing from year to year, 2015 was a really bad year for cotton. The January 2016 baseline wasn't much better. But now we're looking a little bit better with the higher prices in December of 2017.”
The AFPC baseline for rice includes several farms in Arkansas and operations in Louisiana, Mississippi, Texas and California. Rice farms have had their ups and downs.
“The FAPRI projection has rice prices in the $11 to $11.50 per hundredweight range, which is substantially below the $14 reference price,” he said. “In January 2014, we had a little over 40 percent of farms in the red category. 2016 was the best we looked at in the last few years with 60 percent of farms in the green and only about 28 percent of them in the red.
“This December baseline looks pretty bad,” he noted. “There’s not a green farm there. We have high probabilities of cash flow deficits here.”
Richardson said the best rice farmers can hope for is that the prices FAPRI has projected come in above the reference price. “The cost of production is pretty high in rice relative to that reference price. Farmers are depending on that PLC payment to even get these cash flow deficits we're showing here.”
You May Also Like
Enter a zip code to see the weather conditions for a different location.


