Last year at this time, I wrote a column titled “Burdensome old and new crop cotton stocks.” This year the benchmark May WASDE is showing the opposite. This report from USDA projects tight outcomes for both the ‘20/’21 (“old crop”) and ‘21/’22 (“new crop”) marketing years.
Let’s start with the world numbers. The old crop world numbers reflected modest tightening compared to April. On the supply side, world carry-in was lowered 600,000 bales, mostly from reductions in historical Indian production. World production was little changed due to offsetting adjustments in China and India. On the demand side, we saw nearlya half-million fewer bales of consumption, month over month, mostly due to COVID disruption in India. The bottom line was still 300,000 fewer bales of world carry-out.
The new crop world projections reflect higher production, year-over-year, in Brazil, Australia, Mali, Pakistan, India and Turkey. This contribution to new crop supply was offset by lower carry-in and a two million-bale cut in 2021 Chinese production. Global consumption is projected to rise over four million bales, year-over-year, which is an above-average annual increase of 3.5%. The bottom line of this is a two-million-plus-bale cut to world-ending stocks, year-over-year, which is price supportive.
See, WHEAT SCOOPS: Wheat is priced as a feed grain
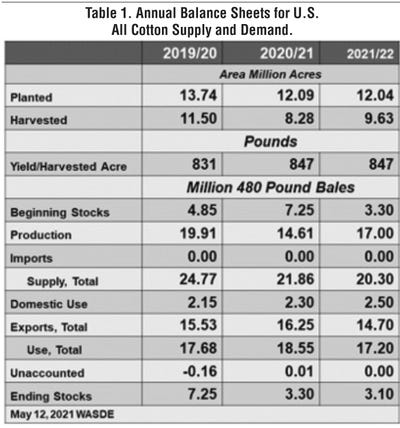
The U.S. cotton supply/demand balance sheets were adjusted in a somewhat expected manner. The size of the 2020 U.S. crop was (finally) cut about 90,000 bales to square with the ginnings and classings. In addition, U.S. old crop exports were raised 500,000 bales to reflect the pace of strong export shipments and accumulated sales. The bottom line of lower production and higher exports was a 600,000-bale cut to U.S. old crop ending stocks, compared to the April projection. This tightening provides an after-the-fact rationale for the strength in old crop cotton futures.
Lastly, USDA released unsurprising projections of the U.S. new crop cotton supply and demand. On the supply side, they applied average yields and assumed 20% abandonment to the 12 million acres of prospective plantings to get a 17 million-bale crop. On the demand side, they assumed a slight recovery in domestic spinning while exports were backed off the historically high pace for a 14.7 million-bale target. The bottom-line result is a relatively tight 3.1 million bales of ending stocks.

It could get even tighter than that. Until I hear otherwise (like, in the September WASDE) I’m inclined to assume 30% abandonment instead of USDA’s current 20%. But, that is an unfolding story with the continued rain events happening over Texas as I write this. In addition, I’m not sure we’ll have 12 million planted when it’s all said and done. Ordinarily, the drought and insurance price would give us a reliably supportive level of Texas plantings, but the sorghum price adds another wrinkle. I wouldn’t be surprised if more corn, peanuts, and soybeans got planted in the Delta and the Southeast than was reported in March. We’ll see.
For additional thoughts on these and other cotton marketing topics, please visit my weekly on-line newsletter at http://agrilife.org/cottonmarketing/.
About the Author(s)
You May Also Like


