
Subscribe to receive top agriculture news
Be informed daily with these free e-newsletters
May 12, 2017
A major benchmark from USDA highlights the risk of lower cotton prices this coming fall. This result came in the long-awaited May World Agricultural Supply and Demand Estimates (WASDE), which is the USDA’s first crack at comprehensive new crop supply and demand projections.
The bearish new crop projections came despite a tightening of the old crop picture. The USDA’s May projections of 2016/17 world cotton supply and demand included a modest month-over-month decrease in projected world ending stocks. This change largely resulted from a 500,000 bale decrease in projected Indian production, combined with a 750,000 bale increase in Chinese consumption. After figuring in a number of other smaller adjustments, as well as a tightening in U.S. numbers, the bottom line was a 1.39 million bale reduction in world ending stocks.
The monthly adjustment in world ending stocks would be moderately price supportive according to theory and history. Moreover, the old crop U.S. numbers were really tightened. The 2016/17 U.S. exports were raised a significant 500,000 bales. This follows an 800,000 bale increase in U.S. exports in the April WASDE.
A BULLISH ADJUSTMENT
There were other small and offsetting adjustments between the U.S. production and the “Loss” fudge factor category. The bottom line was a month-over-month 500,000 bale decrease in projected U.S. ending stocks, to 3.2 million bales. This is a bullish adjustment, and it implies reduced carryover into the new crop balance sheet.
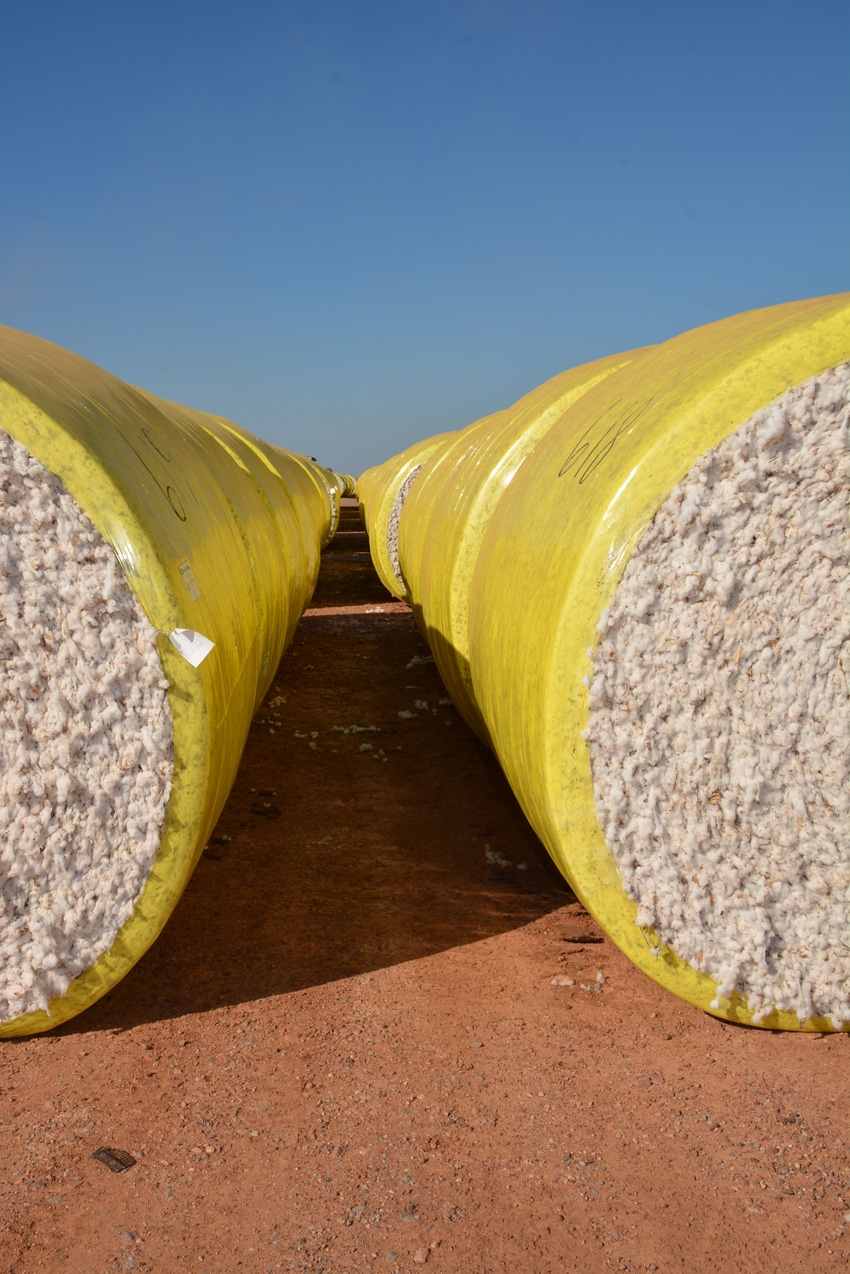
Despite the tighter old crop scenario, the USDA’s new crop projections reflect a large increase in supply, and a picture of static export demand for the 2017 crop. The USDA assumed the March 31 estimate of 12.2 million planted acres of all cotton, which was combined with a five-year average yield and ten-year average abandonment, both weighted by region. (Southwest abandonment was assumed to be 10 percent to represent above average soil moisture conditions.) The result of all this was a hefty 19.2 million bales of production.
LOWER EXPORT DEMAND
The other significant aspect of the May benchmark numbers is that the USDA is not maintaining the level of U.S. exports at 2016 crop levels. There are at least two reasons for U.S. export demand to be lower. The first is that 2017 may not have the widespread exceptional quality that the 2016 crop had. Second, the market for the 2017 crop will have to digest larger foreign supplies, as well as a healthy U.S. crop.
It is certainly possible to still have brief bursts of higher futures prices from weather market situations, driven by speculative buying. We saw that effect in the summer of 2016. But the 2017/18 balance sheet suggests a lot of downside price risk.
Growers should consider that the Dec’17 contract could trade from the mid-70s to the mid-50s over the next six months. Given the possibility of a 15 cent to 20 cent decline in price, it may be worth spending three or four cents for downside price insurance in the form of a put option or put spread (see Figure 1).
For additional thoughts on these and other cotton marketing topics, please visit my weekly on-line newsletter at http://agrilife.org/cottonmarketing/

Figure 1
You May Also Like
Enter a zip code to see the weather conditions for a different location.


