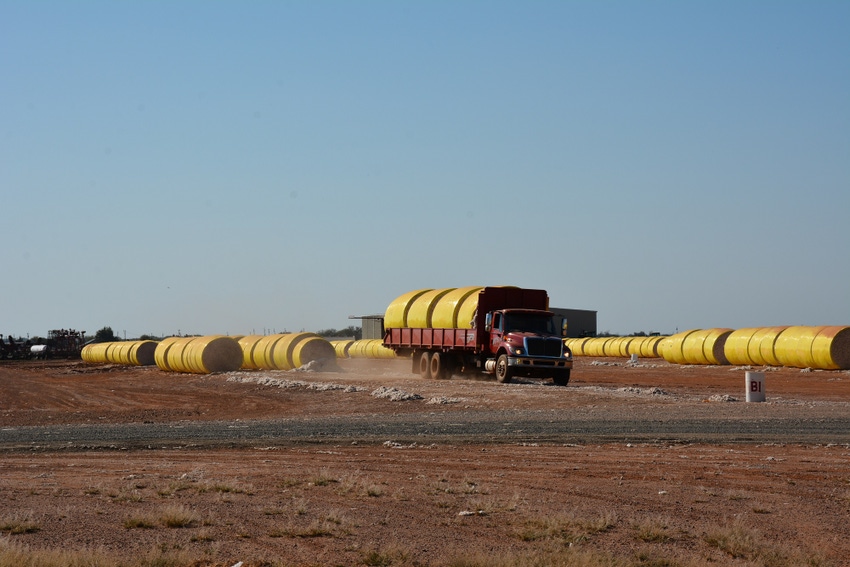
U.S. exports were increased by 300,000 bales over the December report (which raised them 200,000 bales over the November report). The current adjustment likely reflects both having more production/exportable surpluses, as well as a short term gain in U.S. market share from quality and export glitches in other countries like India.
January 25, 2017

USDA’s January projections of 2016/17 U.S. and world cotton supply and demand variables were bearish. Projected U.S. ending stocks were weighed down by a substantial 435,000 bale month-over-month increase in U.S. production.
It should be remembered that this comes after 130,000 and 360,000 bale U.S. production increases in November and December, respectively. In other words, a big crop is getting bigger. As in previous months, the bulk of the increases were from Texas.
U.S. exports were increased by 300,000 bales over the December report (which raised them 200,000 bales over the November report). The current adjustment likely reflects both having more production/exportable surpluses, as well as a short term gain in U.S. market share from quality and export glitches in other countries like India.
After a small adjustment to the “Unaccounted” category, the bottom line was a 200,000 bale increase in projected ending stocks, to 5 million bales. This follows a combined 500,000 bale increase since the November report. Such monthly adjustments would ordinarily have a negative price response, and this was reflected in the January 12 post reported lower trading of ICE cotton futures.
MARKET REACTION
What probably drove the market reaction to the U.S. numbers was not so much the size of the ending stocks adjustment as the surprising direction.
Pre-market opinions appeared to expect the increases in exports to outweigh any production increases. In other words, the market was probably expecting a decrease in ending stocks, instead of the opposite.
In hindsight, it makes sense that we might be seeing larger than normal adjustments in production after the new year since this is the effect of later than normal rains, boll set, crop maturation, and harvesting. The result has been above average yields and production in northwestern Texas that rival 2007 and 2010, by most accounts.
The January world cotton numbers also included month-over-month production increases, with an extra one million bales in China adding to the U.S. increase to outweigh a 350,000 bale decrease in Pakistan. Other smaller adjustments in the world numbers included a roughly 300,000 bale increase in the trade variables, and a small 90,000 bale increase in world beginning stocks.
SLOW REDUCTION IN STOCKS
World consumption was decreased by a small 150,000 bales, although this involved offsetting adjustments between China (+500,000 bales) and India (-500,000 bales), plus some small reductions in Turkey and Mexico.
The bottom line of all this was a month-over-month increase in world ending stocks for 2016/17 of 1.5 million bales. Such a monthly adjustment would ordinarily be price=weakening. based on both history and theory (see Figure 1). However, the typical market reaction to such monthly adjustments is also brief.
The longer term impact on prices is in the year-over-year change in ending stocks (or stocks-to-use ratio, which is the vertical scale in Figure 1). This year-over-year adjustment appears as a downward stair-stepping pattern on the right hand side of Figure 1. It shows that the world is making slow progress toward lower stocks.
I expect old crop cotton futures to remain in their current low -70s range during the first quarter of 2017. A large imbalance of unfixed call sales (from merchants to mills) to unfixed call purchases (from suppliers by merchants) suggests there could be brief bursts of excess buying of ICE cotton futures as the March, May. and July contracts mature. Such upward volatility has the potential to pull up on new crop Dec’17.
On the other hand, the U.S. will face more competition from new crop supplies that will begin to flow from Australia and Brazil in the second quarter.
For additional thoughts on these and other cotton marketing topics, please visit my weekly on-line newsletter at http://agrilife.org/cottonmarketing/
About the Author(s)
You May Also Like


